AV logMAR #
All charts have been designed according to the logMAR principles proposed by Bailey and Lovie (1) that are currently accepted worldwide as the gold standard for visual acuity measurement.
According to logMAR design, all charts have the following characteristics:
1. Equal numbers of targets (letters or symbols) per line: All lines have 5 targets (except low acuity values, for which 5 targets cannot fit on the screen). This results in equally valid measures of acuity at all sizes, as well as a more precise calculation of visual acuity (see below).
2. Standardized spacing between lines and letters: Letters in the same line are separated by one letter’s width, and lines are spaced by the width of the letter on the smaller line.
3. Standardized progression of letter size between lines: The size of the letters varies by uniform steps on a logarithmic scale, changing by a factor of 1.26 from line to line. This logarithmic (proportional) size progression leads to a linear increase in recognizability according to the Weber-Fechner Law. It also guarantees that the letter sizes vary by the same ratio at high (small targets) and low (large targets) acuity values.
4. Contour interaction: The design we just described, with a standard separation between consecutive letters and rows, also results in a standardization of contour interaction at each level of acuity. At each level, there is consistent effect from contour interaction.
5. Letters of similar difficulty: Some letters are easier to identify than others. For a valid measure of visual acuity, it is very important that the letters be of equal difficulty. The letters used in each line of the chart tests have been carefully selected, so that each line has a similar global difficulty (obtained by summing all letter difficulty scores in each row). Also, even though rows may contain a different set of letters, each row is equal in difficulty to the other rows, at all levels of acuity.
6. The final VA value is based on the total number of letters (or symbols) that are identified correctly. The acuity value is expressed according to a logarithmic scale, in which each letter has a numerical value. This allows precise quantification, taking into account all correct and incorrect identifications, by simply adding together all the letters that were identified correctly at each level of acuity. This type of acuity determination affords greater accuracy and reliability than other methods.
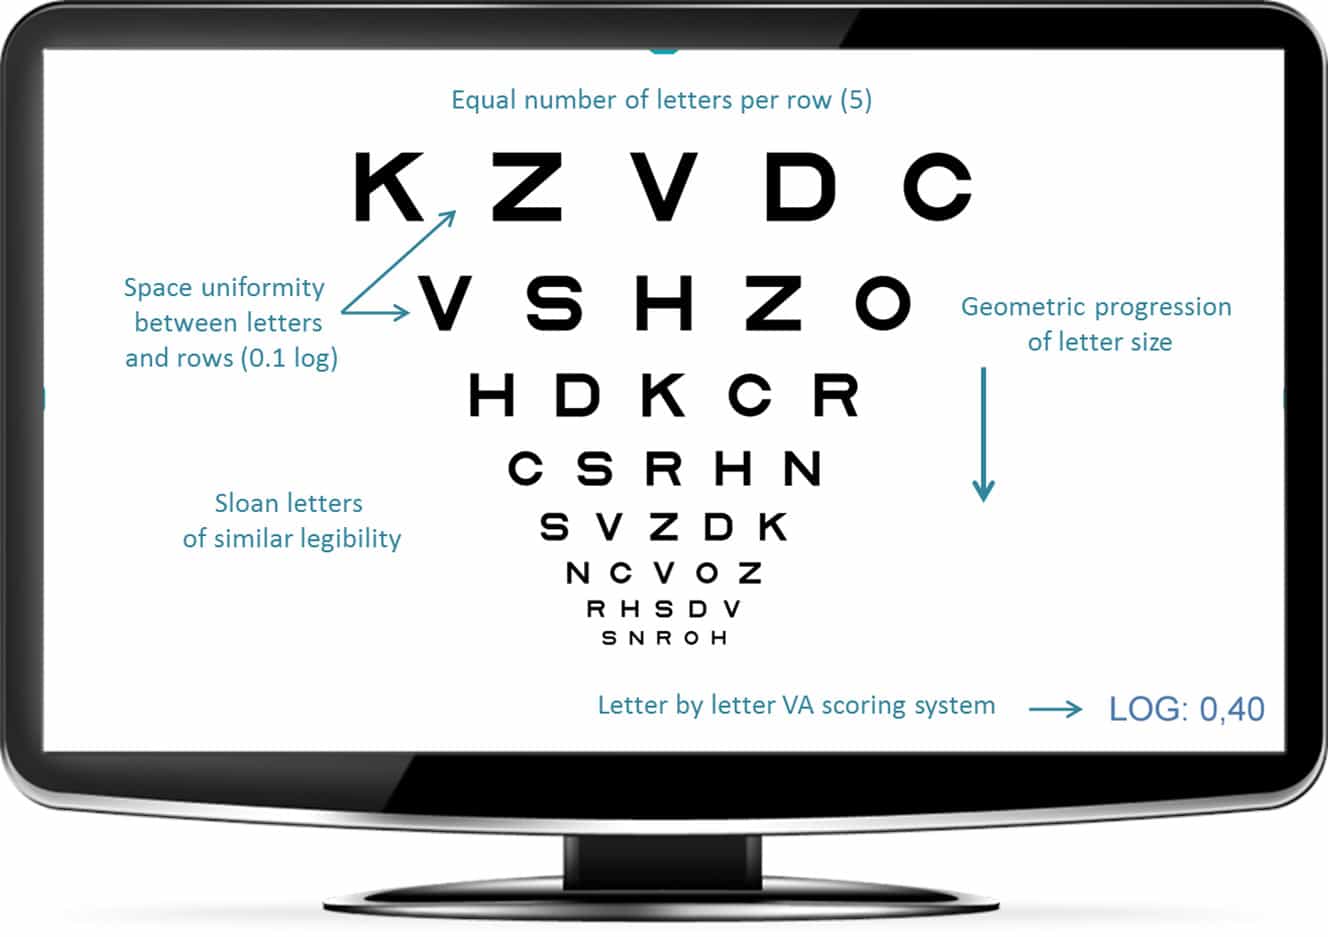
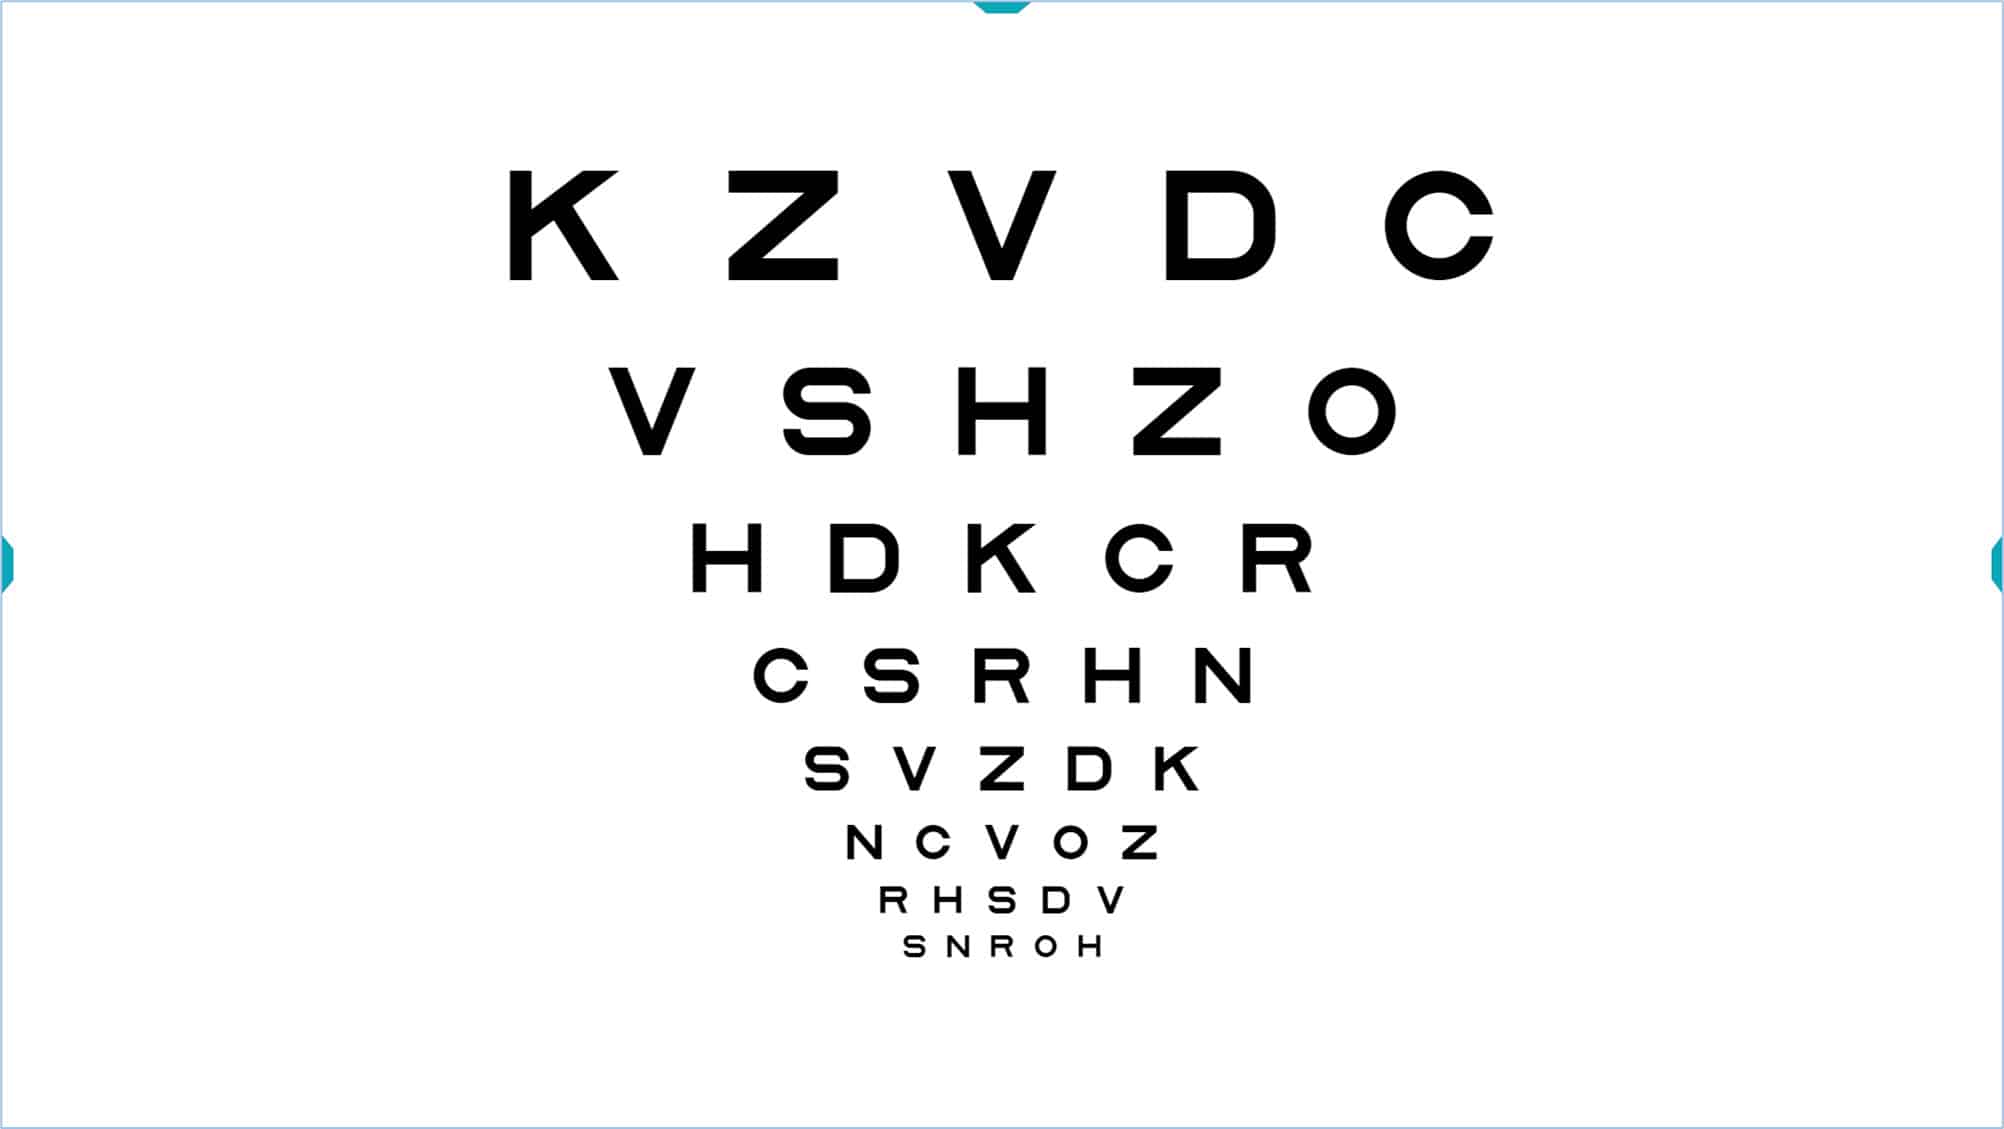
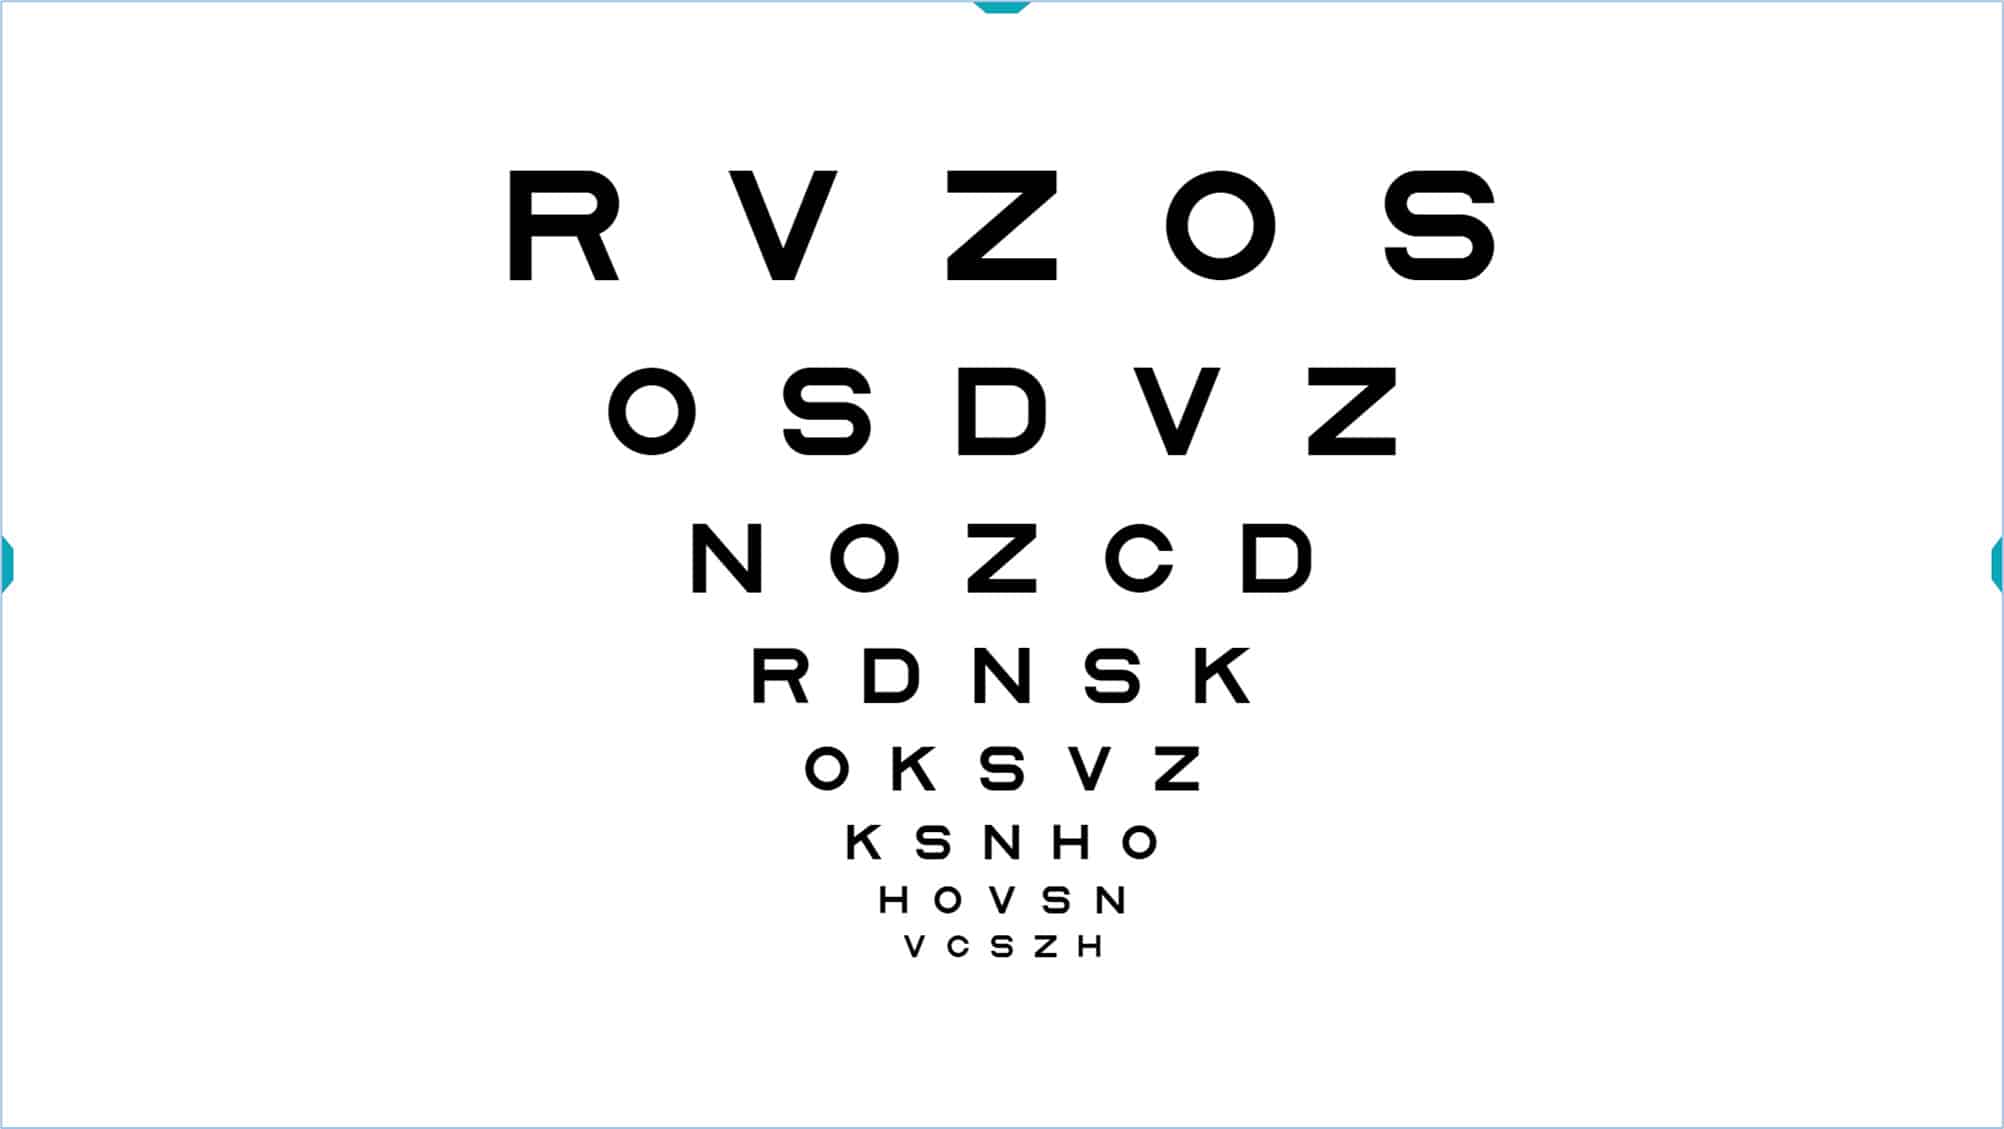
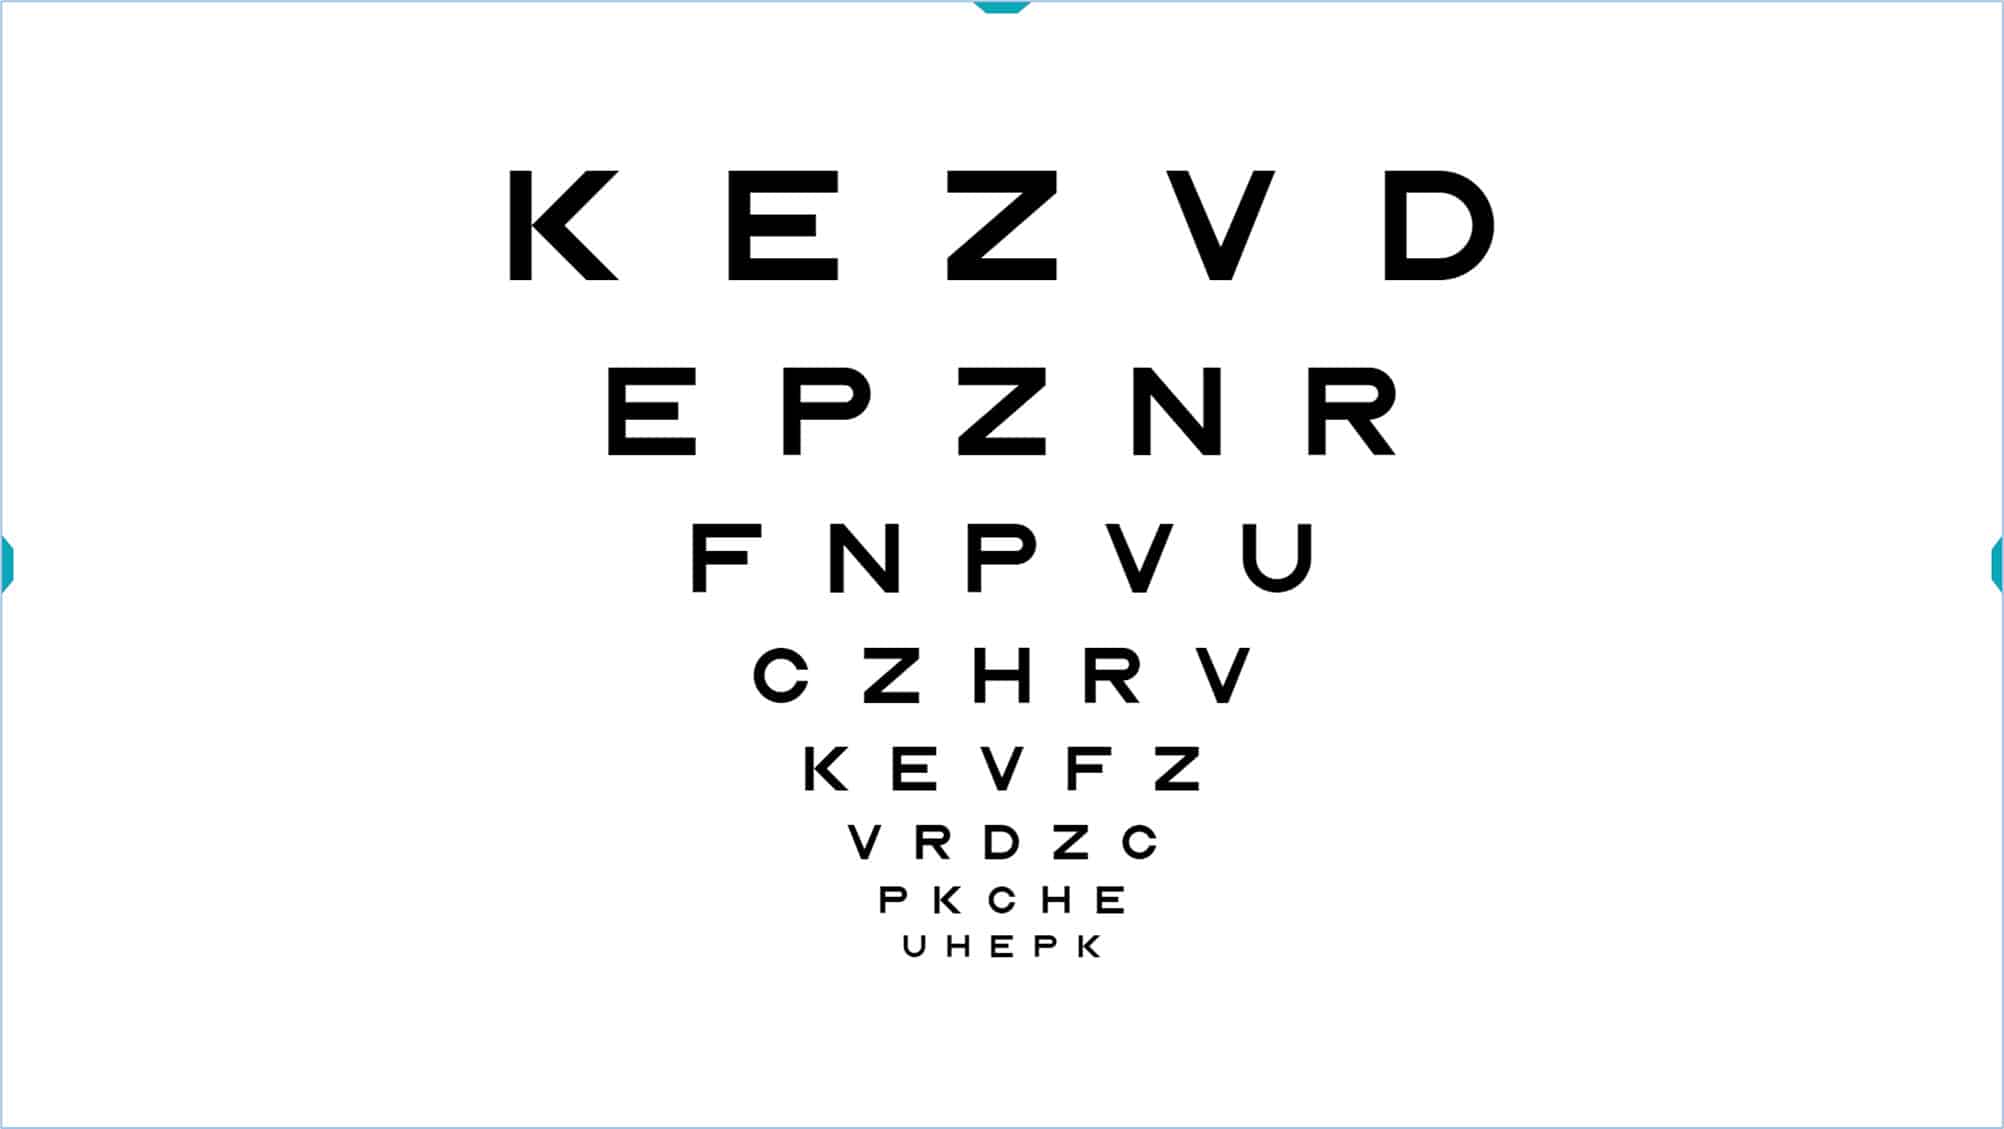
Logarithmic Visual Acuity (VA) optotype with Sloan letters (ETDRS), where the characteristics we have just described are evident.
Below, we explain in more detail how the logarithmic notation is made.
Logarithmic Notation #
The logarithmic acuity values are obtained by calculating the logarithm of the minimum angle of resolution (MAR). For example, a VA of 1.0 Dec (Snellen equivalent of 6/6 or 20/20) corresponds to a MAR of 1 minute of arc. Since the logarithm of 1 is 0, the logarithmic value corresponding to this VA (6/6 or 20/20) will thus be 0.
In a logMAR chart, the optotypes (letters or symbols) change in size from one line to another in geometric progression, multiplying by a factor of 1.26. With this progression, the letter size is doubled every 3 rows, and increased 10 times per every 10 rows. If we take the log of the visual angle for each letter size, we convert the geometric sequence into a linear sequence, in which each row changes 0.1 log units.
In the logarithmic scale, the acuity values vary with the letter size, such that the smaller the letters the patient sees, the smaller the log acuity value will be. Each row is 0.1 logarithmic units less than the previous one and since every line contains 5 letters, so we can assign to each letter the value of -0.02 log units (subtract 0.02 log units for each letter the patient identifies). Thus, the logMAR acuity value tells how many letters the patient identified correctly, simplifying numerical notations, increasing the accuracy of the VA measurement, and allowing more standardized measurements. The logMAR notation is always used in clinical research due to these advantages.
In the following example, we have crossed out the letters that the patient correctly identified:
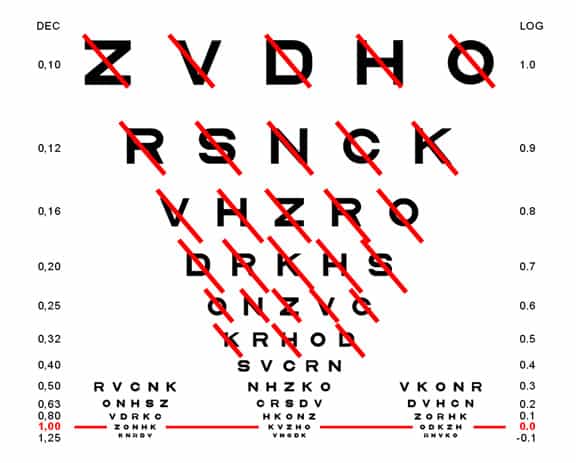
The patient saw all the letters in the line 0.6 log and three letters in the next row (K, H and D). Therefore, at the value of 0.6 we will subtract 0.02 for each successful letter of the next row (0.5) and thus we conclude that the acuity is: 0.6 – 0.06 = 0.54 log units.
In this other example:
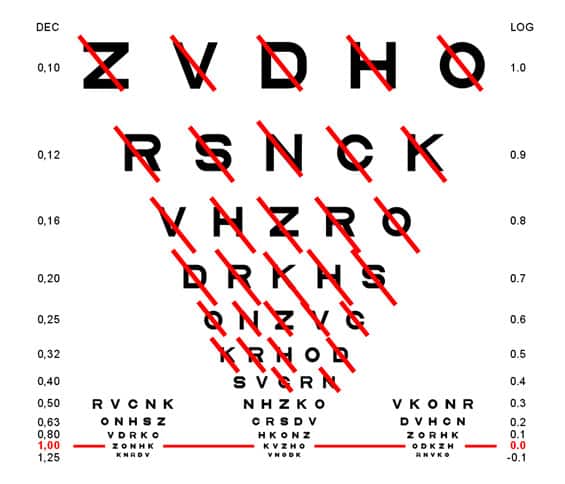
The patient saw all lines on the line 0.6 plus 4 letters on the 0.5 and 2 on the 0.4. The acuity will therefore be 0.6 – 0.08 – 0.04 = 0.48 log units.
VA Rating (VAR) or VA Score (VAS) #
One problem with logarithmic notation is that it is not intuitive, because the better the vision, the lower the acuity value. Thus, the very best acuity values are negative. To solve this problem, Bailey proposed an alternative notation method based on the following formula: (2)
Visual Acuity Rating (VAR) = 100 – 50 x logMAR
Which consists of subtracting from 100 the value obtained by multiplying the VA log by 50.
With this notation, a value of “1” is assigned to each letter, and we add the value of all letters that the patient has successfully identified. Each line has five letters, so 5 points are added if all letters are seen. A VA of 6/6 (20/20, or 1.0 in decimal notation) corresponds to a logarithmic value of 0 (not very intuitive) whereas the VAR notation assigns a value of 100 (much more intuitive). If the patient reads a letter incorrectly, the value of his VA would be 99, two incorrect letters yield a score of 98, and so on. On the other hand, the patient gets an additional point for reading any letter smaller than 6/6 (20/20, or 1.0 in decimal notation). For example, 6/6 +2 becomes 102 VAR, a value that is sensitive, standardized, and intuitively understood as “better”.
Thus, this system maintains the advantages of logarithmic notation, but avoids negative values, is very easy to calculate and offers a more intuitive number, which the patient can easily understand (higher values indicate better acuity).
For example, the letters that a patient has identified correctly are shown below:
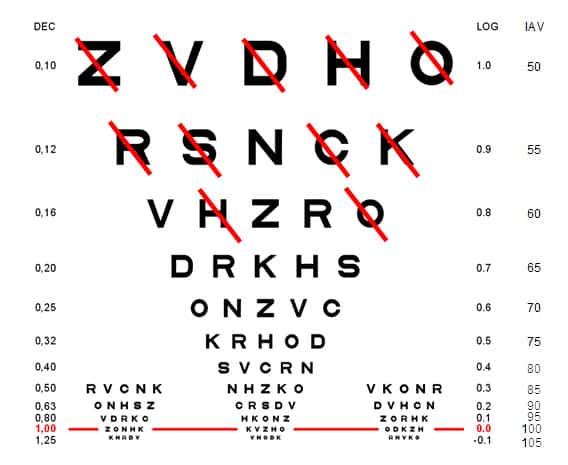
Using the method described above, the logarithmic VA in this example is 0.88 log units, while the Visual Acuity Rating is 56 VAR.
VA Tools Menu #
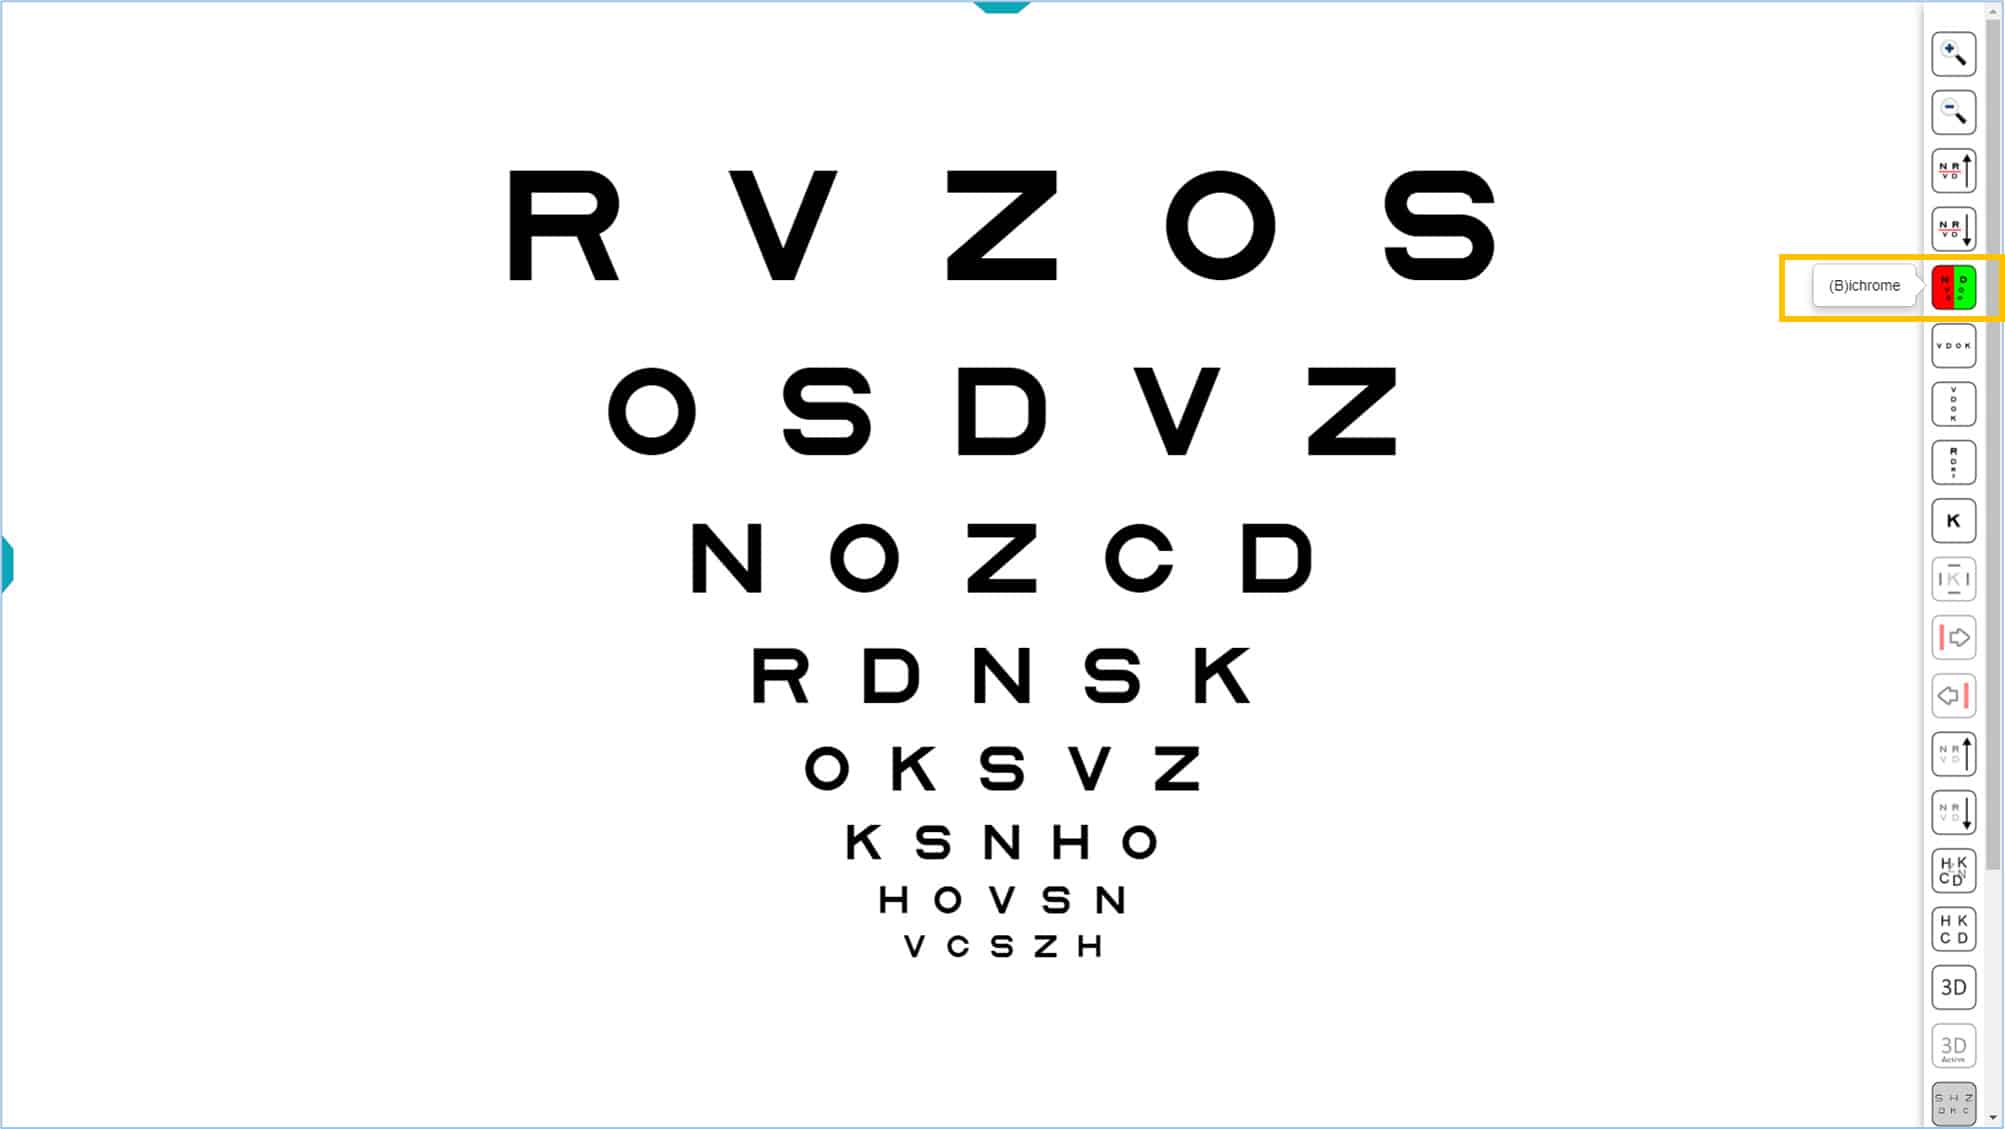
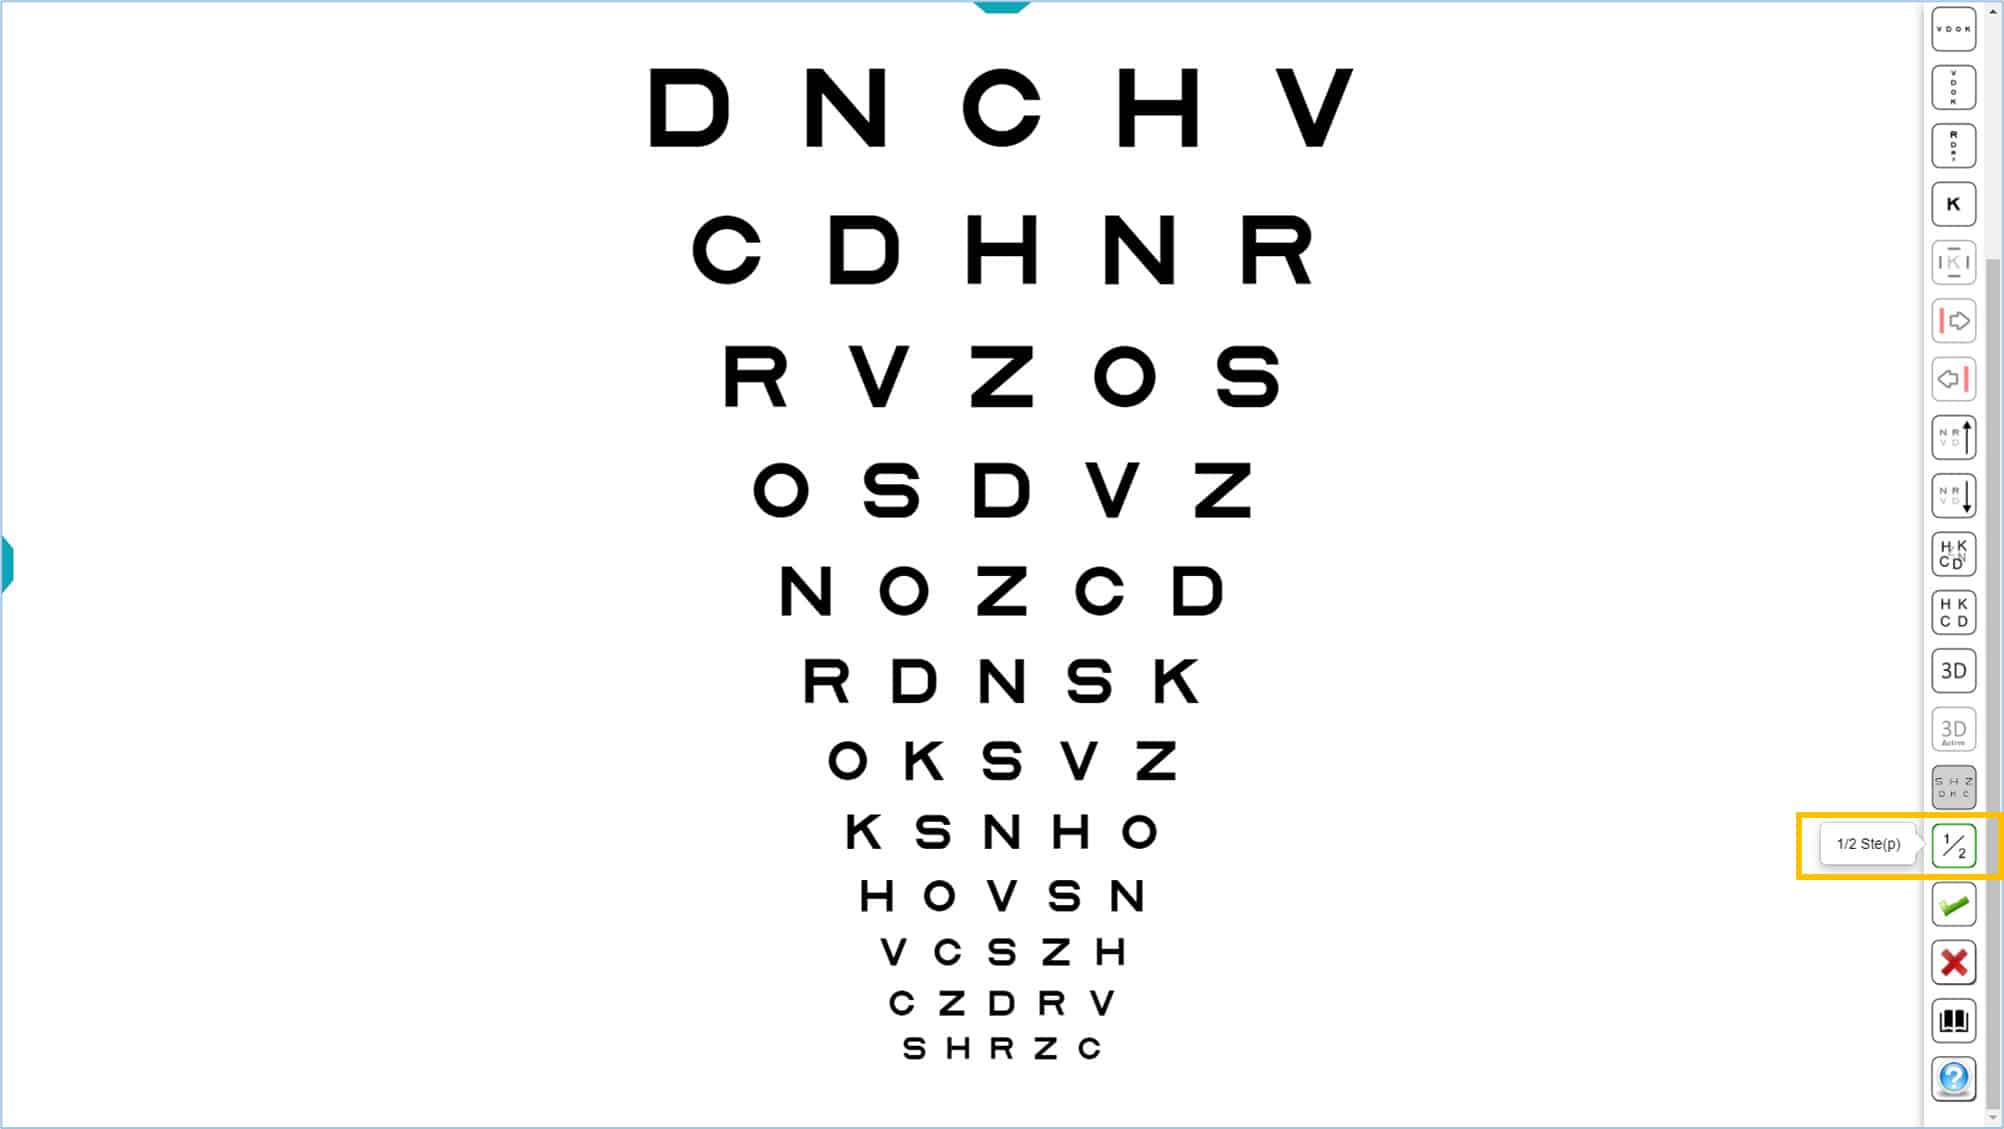
The Vision Unit allows great flexibility in testing. Each VA chart has a Tools Menu, which appears on the right by clicking on the colour mark at the right of the screen (or pressing on the combination of keys: Ctrl + Alt + M). Otherwise, the Tools Menu is hidden.
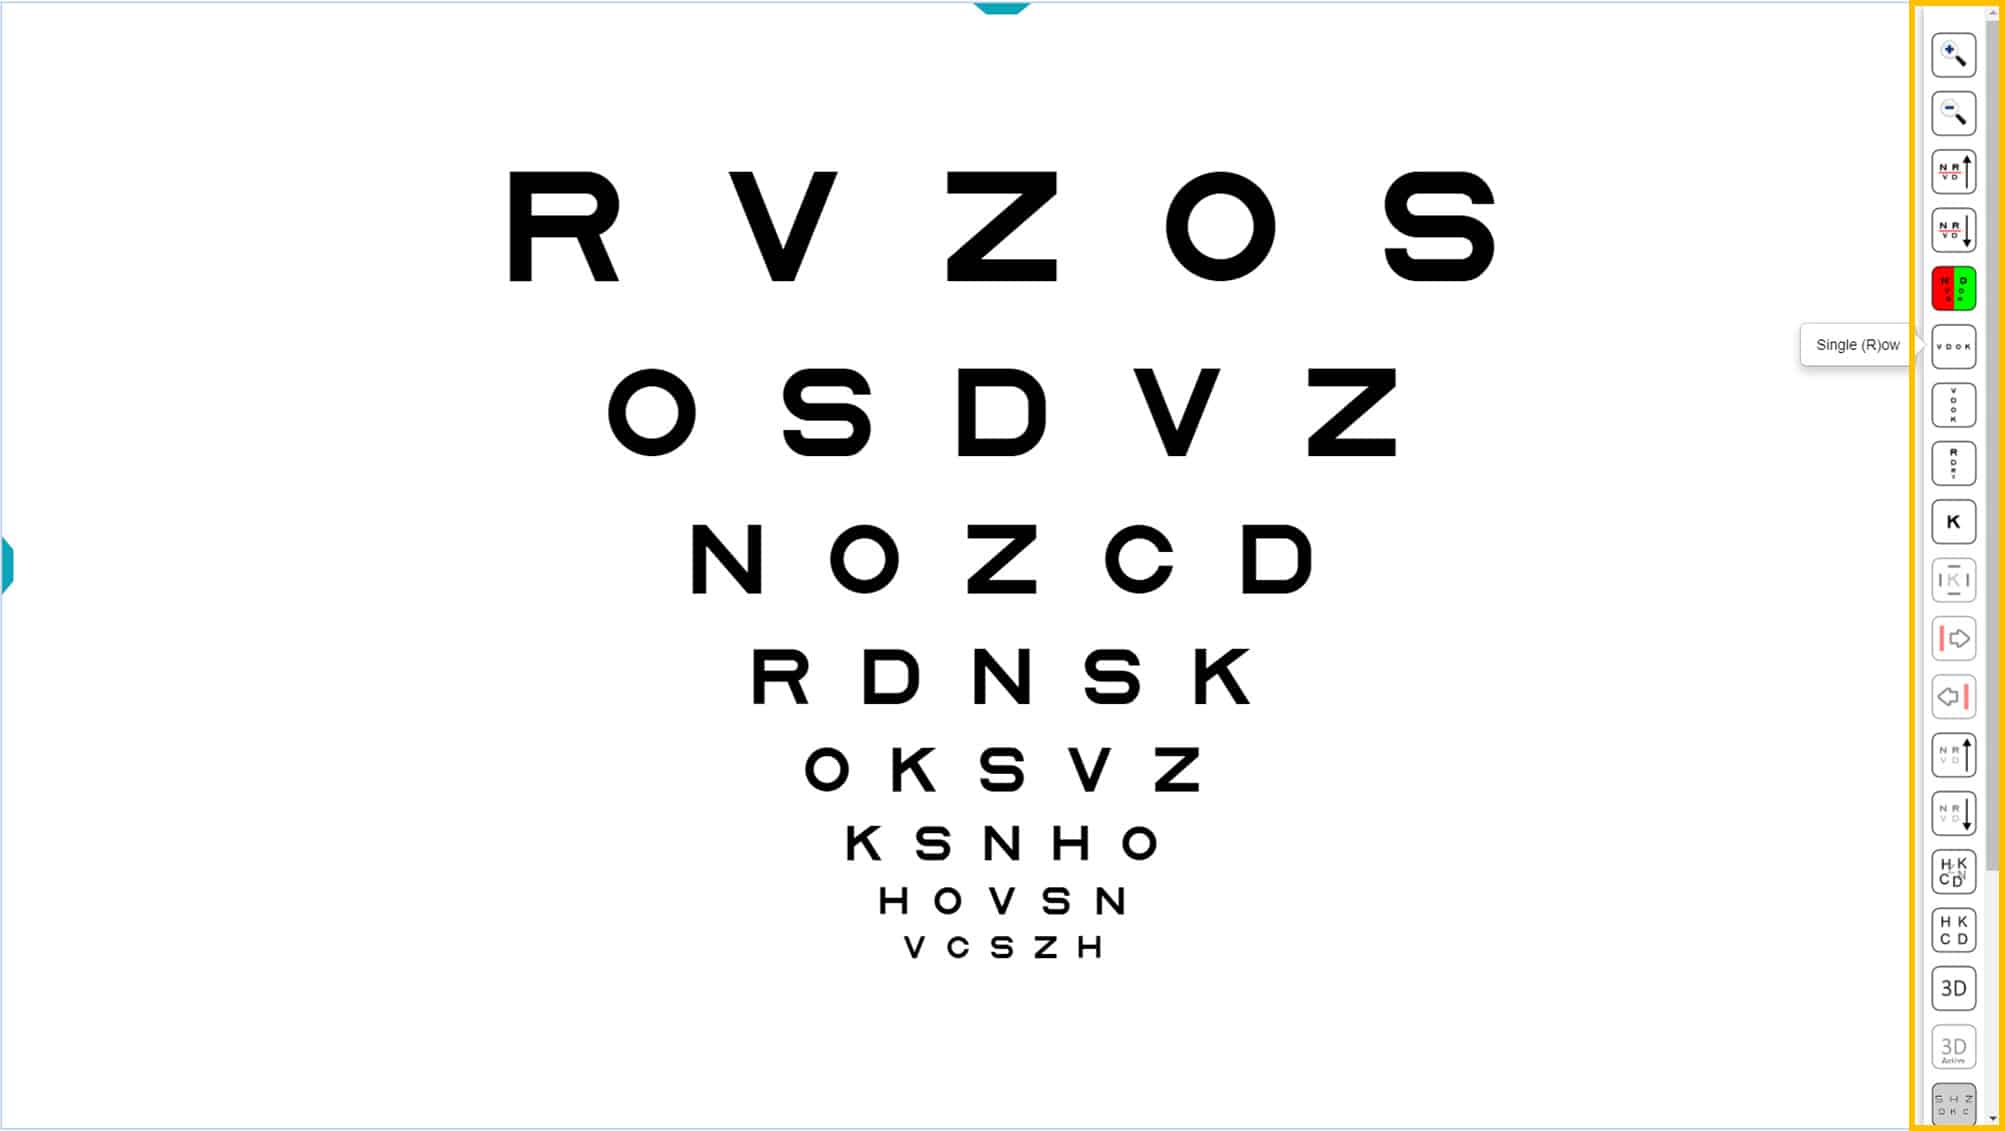
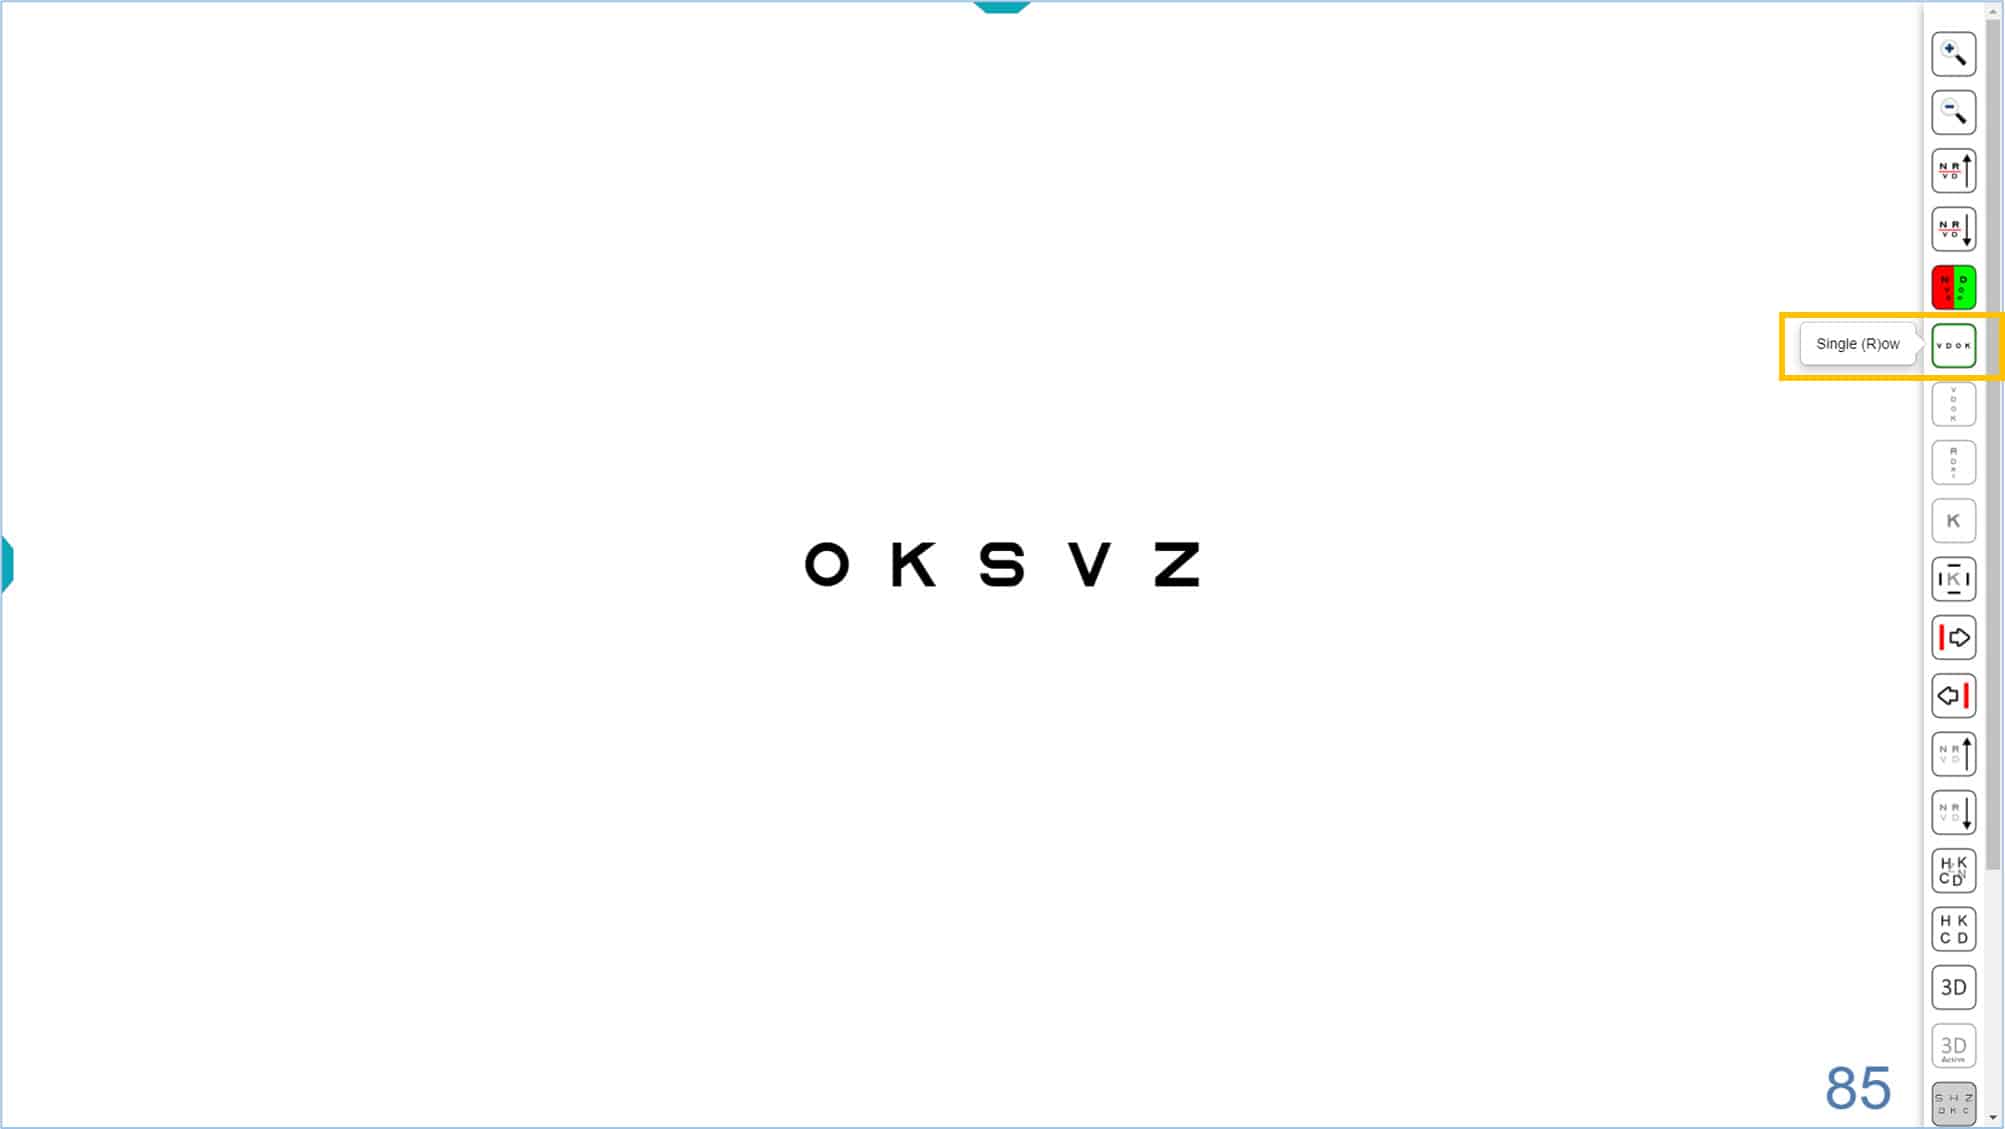
Each function has an icon, as well as a keyboard shortcut. The letter for the keyboard shortcut is shown in parentheses in the Tools Menu when hovering the mouse over the corresponding icon. For example, in the above image, “Single (R)ow” appears next to the corresponding icon. So, clicking the icon or typing “R” results in showing a horizontal row of letters.
The same Tools Menu appears for all charts, regardless of the optotype used (letters, numbers, or symbols). Therefore, although the discussion below is limited to letter charts, the same functions are available for charts with numbers or symbols.
The Tools Menu has the following options:
Selecting Rows and VA Values #
The Tools Menu can be used to add a red line to indicate which row the patient should read. The red line appears by clicking on the “line up”, or “line down” icons in the Tools Menu.
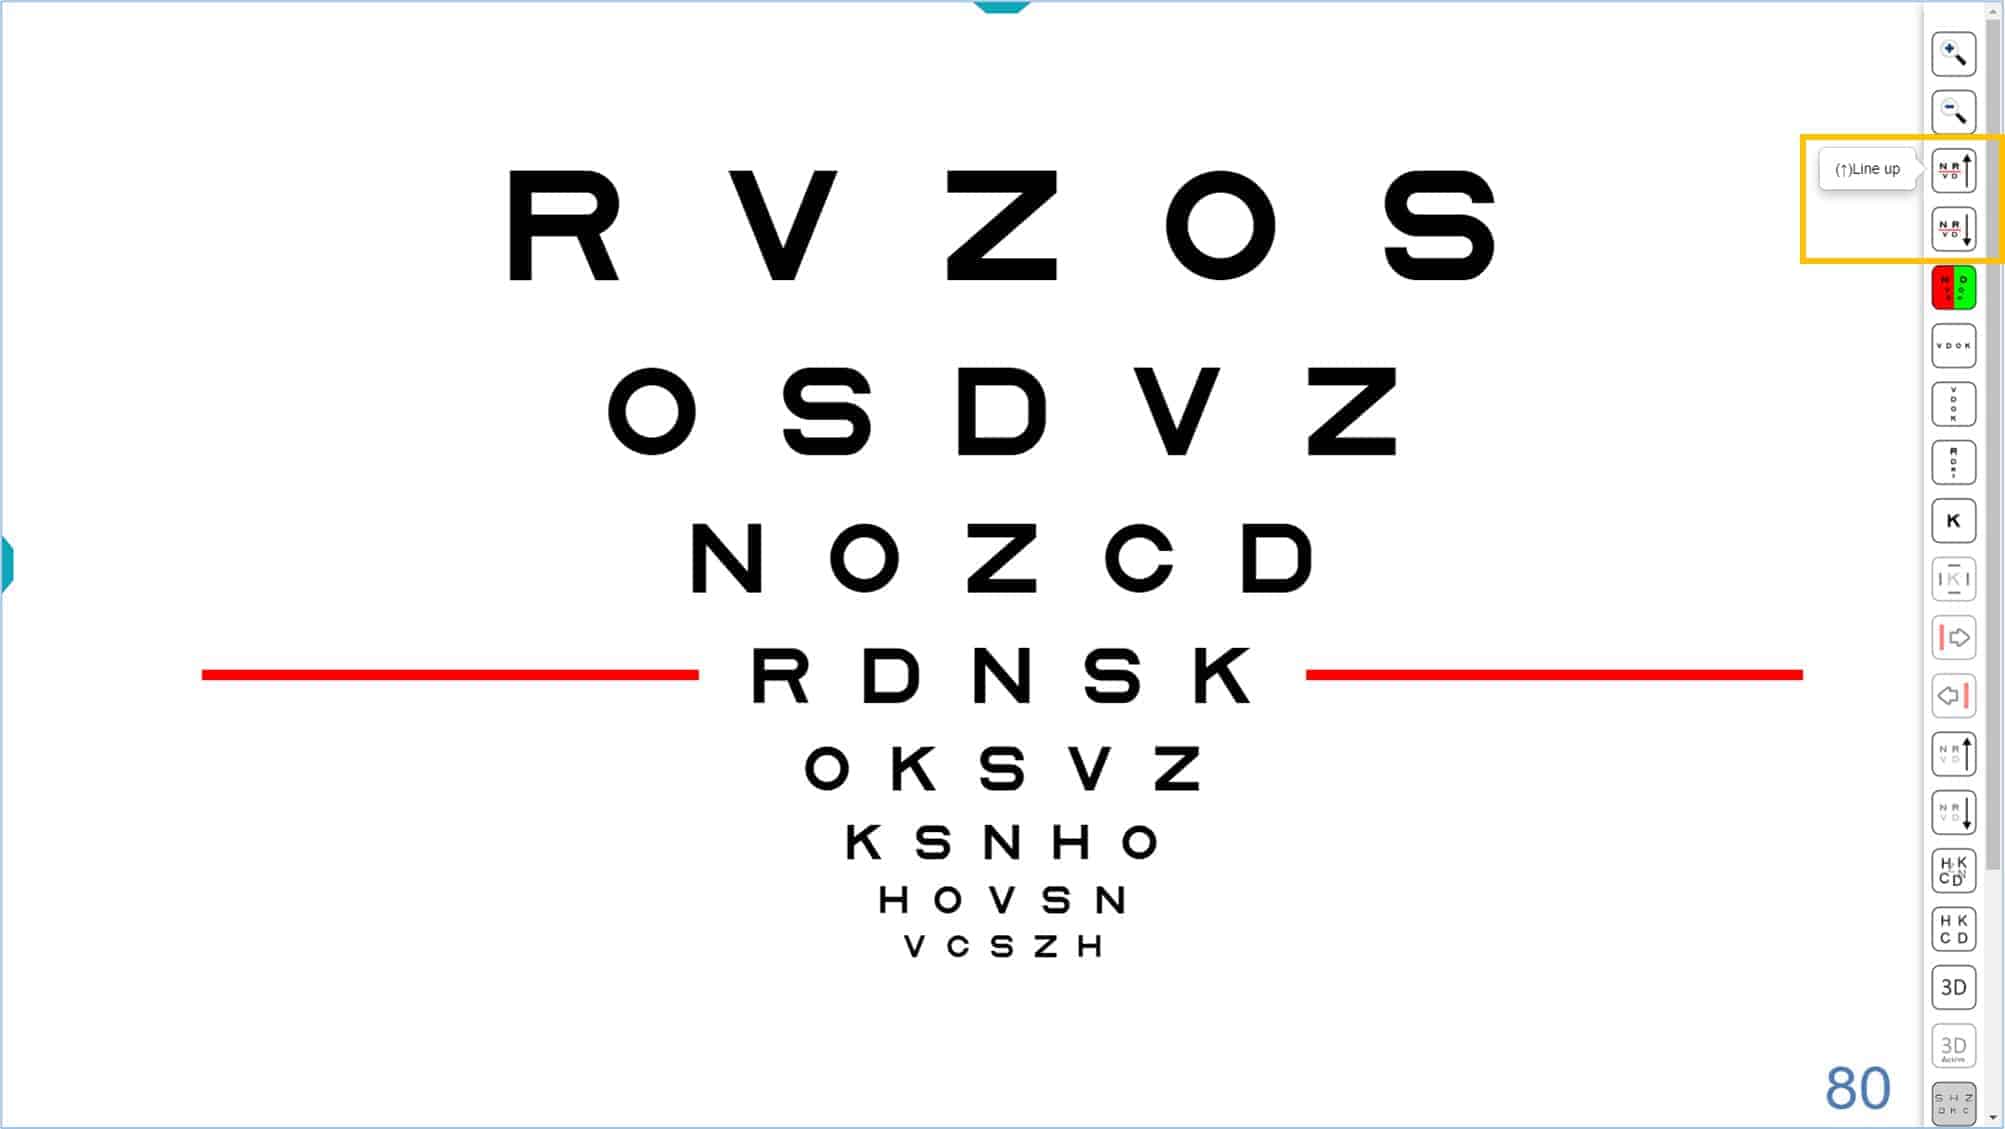
The keyboard shortcut (arrow keys up ↑ and down ↓) will also show the red lines. When you press the ↑ arrow, the red line will appear at the bottom of the chart. The red line will go up one level after each additional click. Similarly, when you press the ↓ arrow, the red line appears at the top of the chart and goes down one level for each additional click.
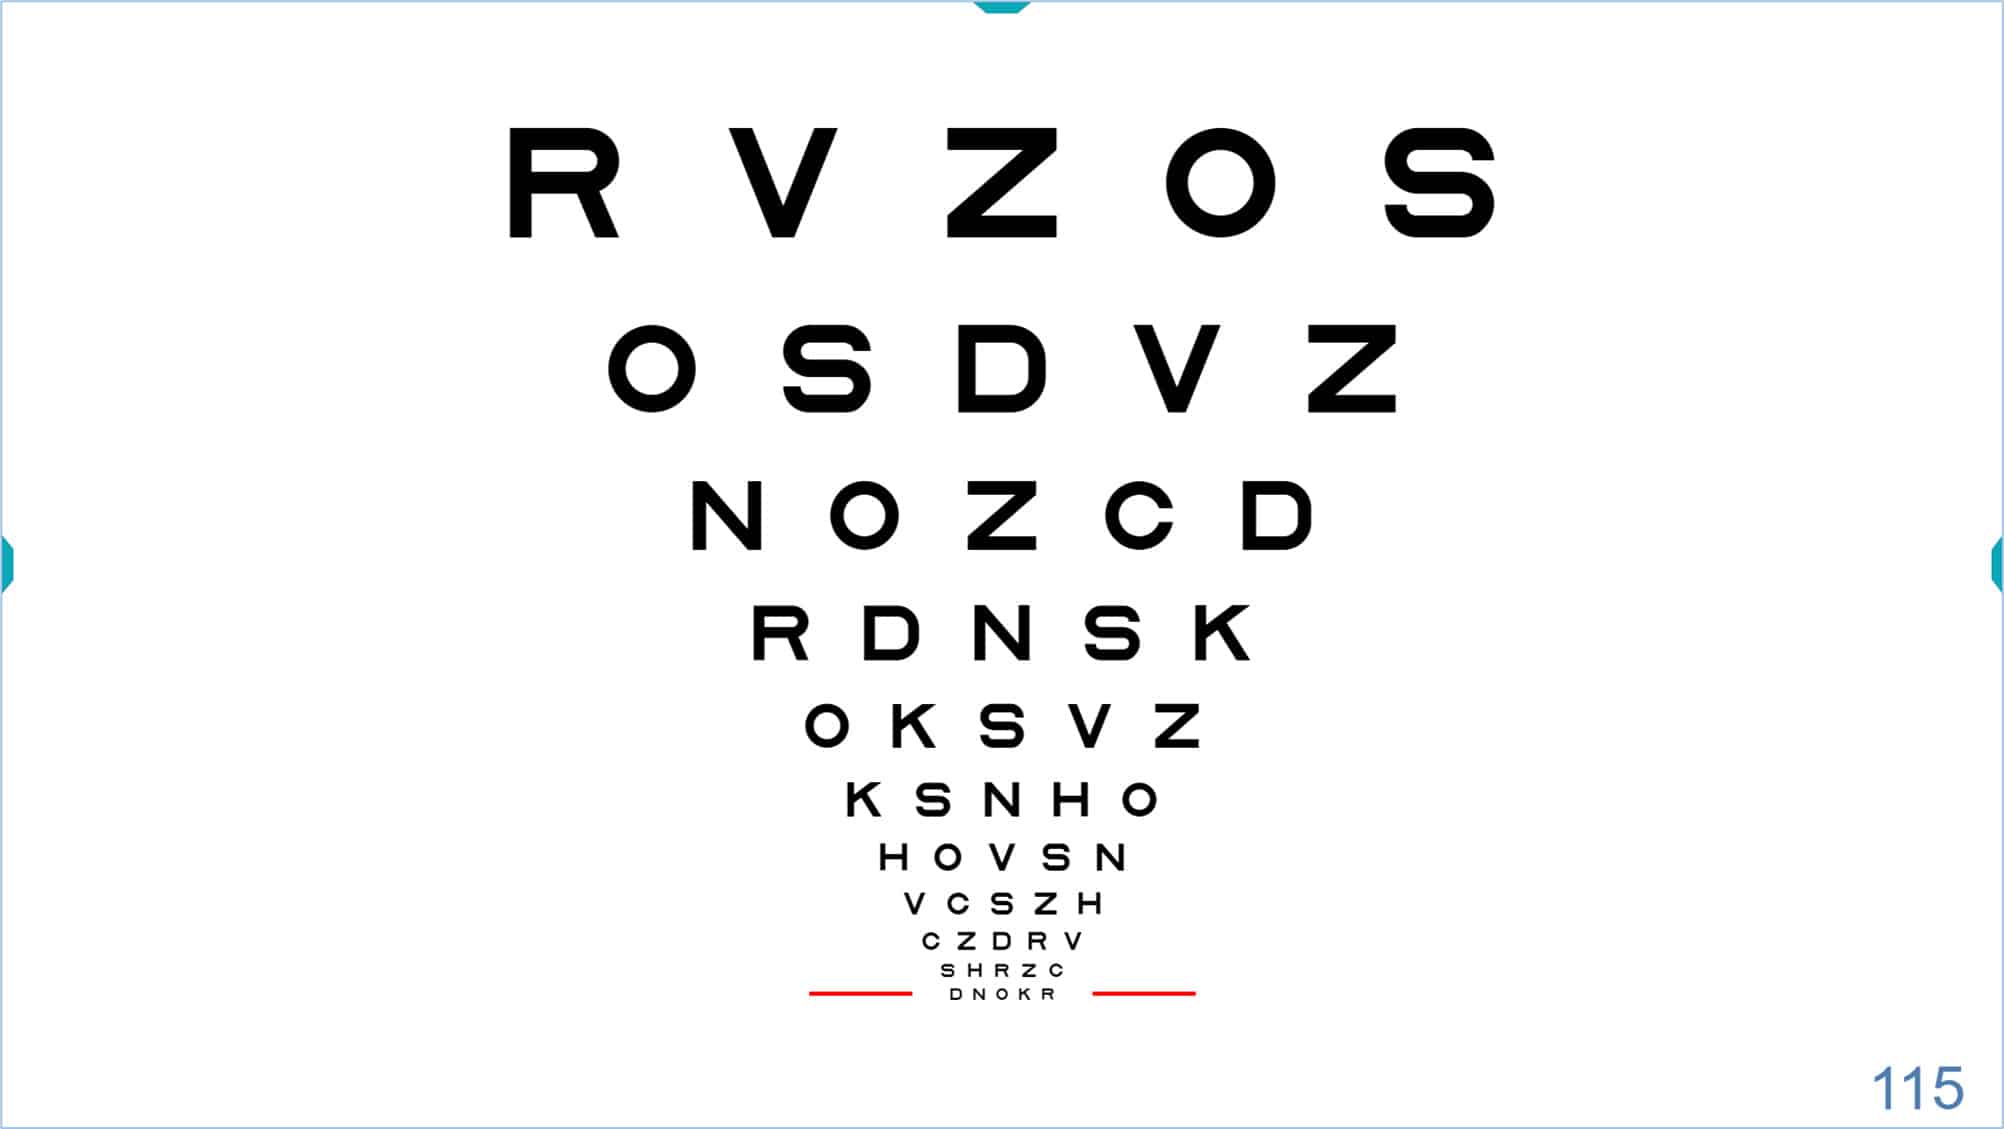
When you reach the end of the displayed chart, you may continue to click the ↓ arrow to display smaller letters, until the minimum size of -0.30 log (115 VAR) (also determined by the resolution of each screen) is reached.
 |
 |
Similarly, if you have reached the upper row of the chart, you may continue to press the ↑ arrow and larger letters will appear. (Maximum letter size is explained below.)
 |
 |
The up ↑ and down ↓ arrows above are usually very accessible on all keyboards, especially on mini wireless keyboards that can also be used as a remote control.
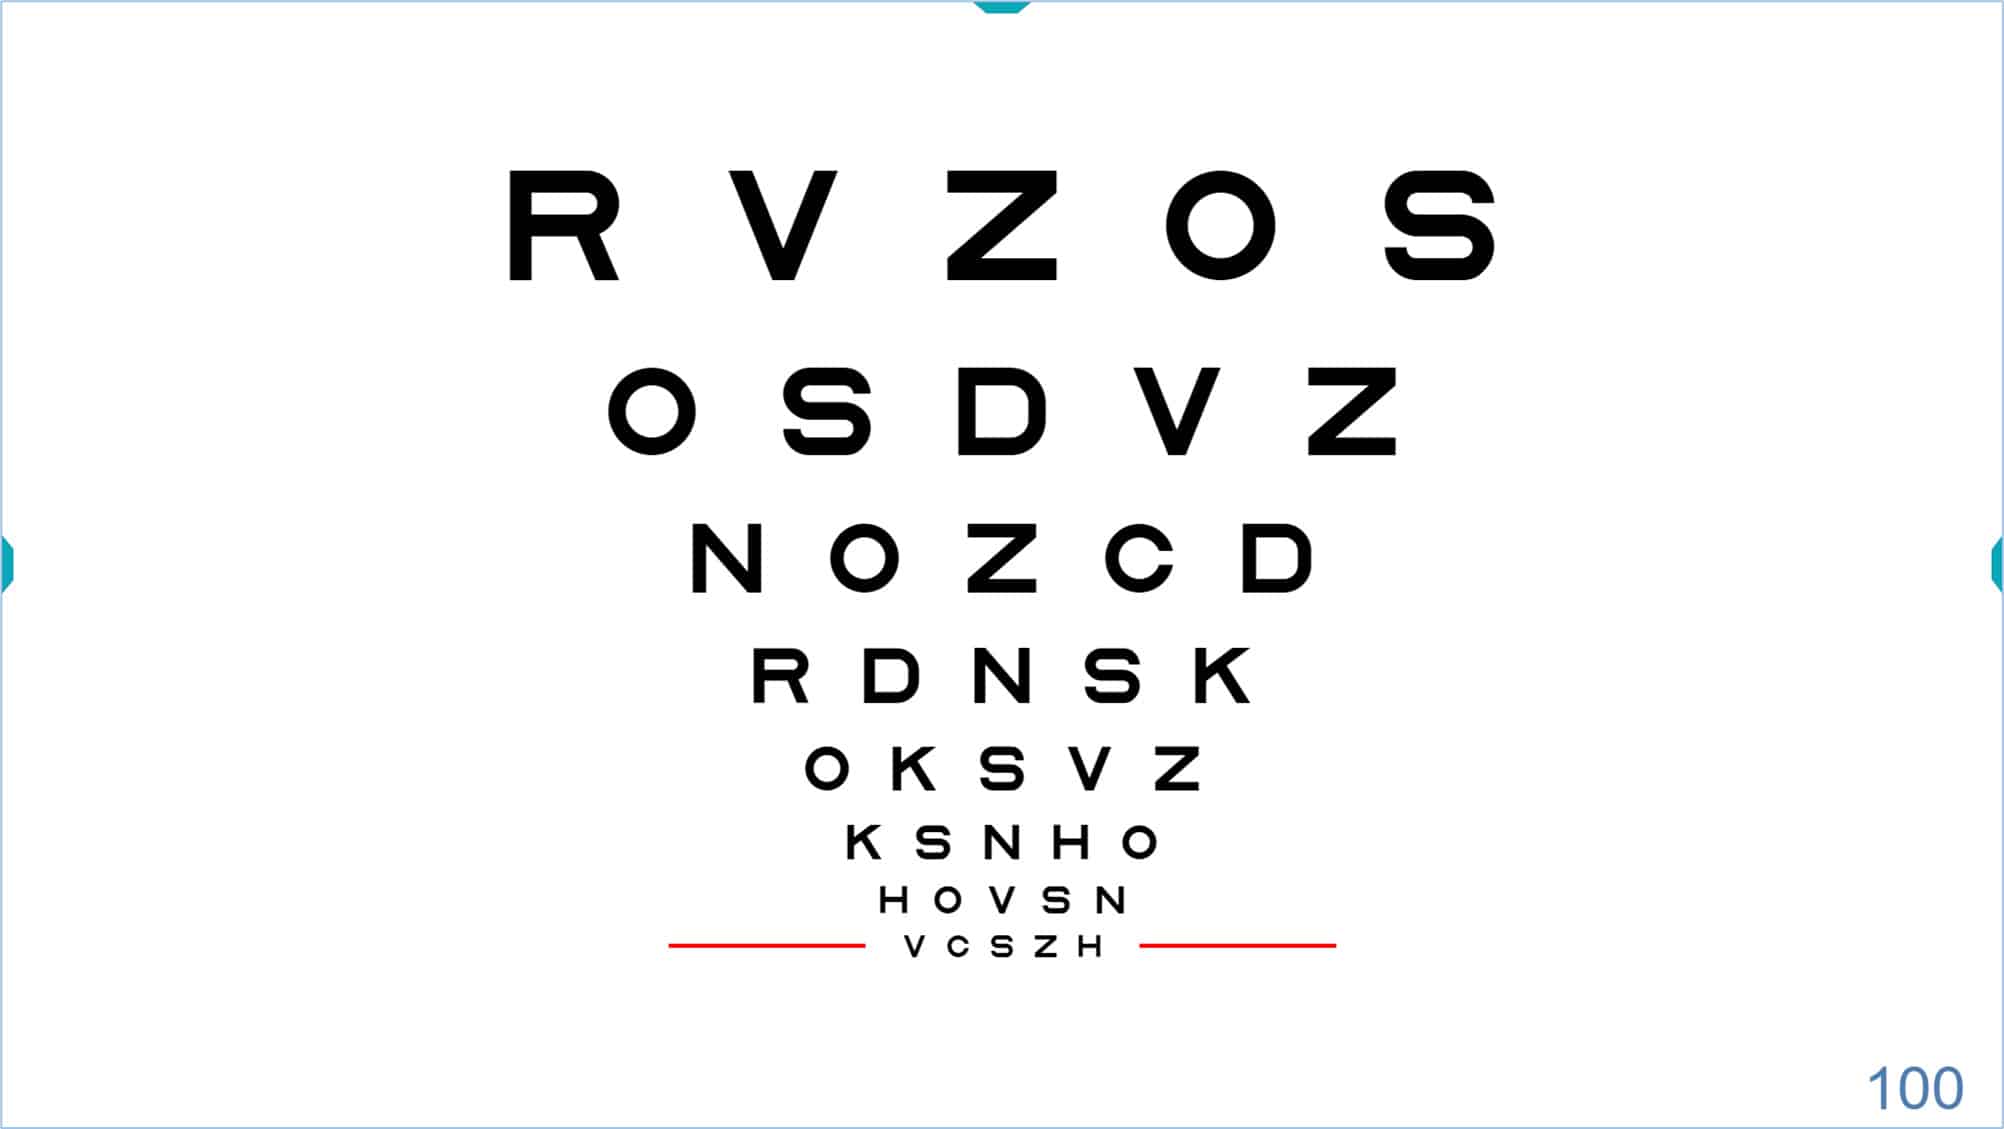
Whenever possible, these red lines will be displayed on both sides of the indicated letter row. However, if the size of the letters and the screen limit the horizontal display, the red line will be shown just below the row in question.
Visual Acuity Notation #
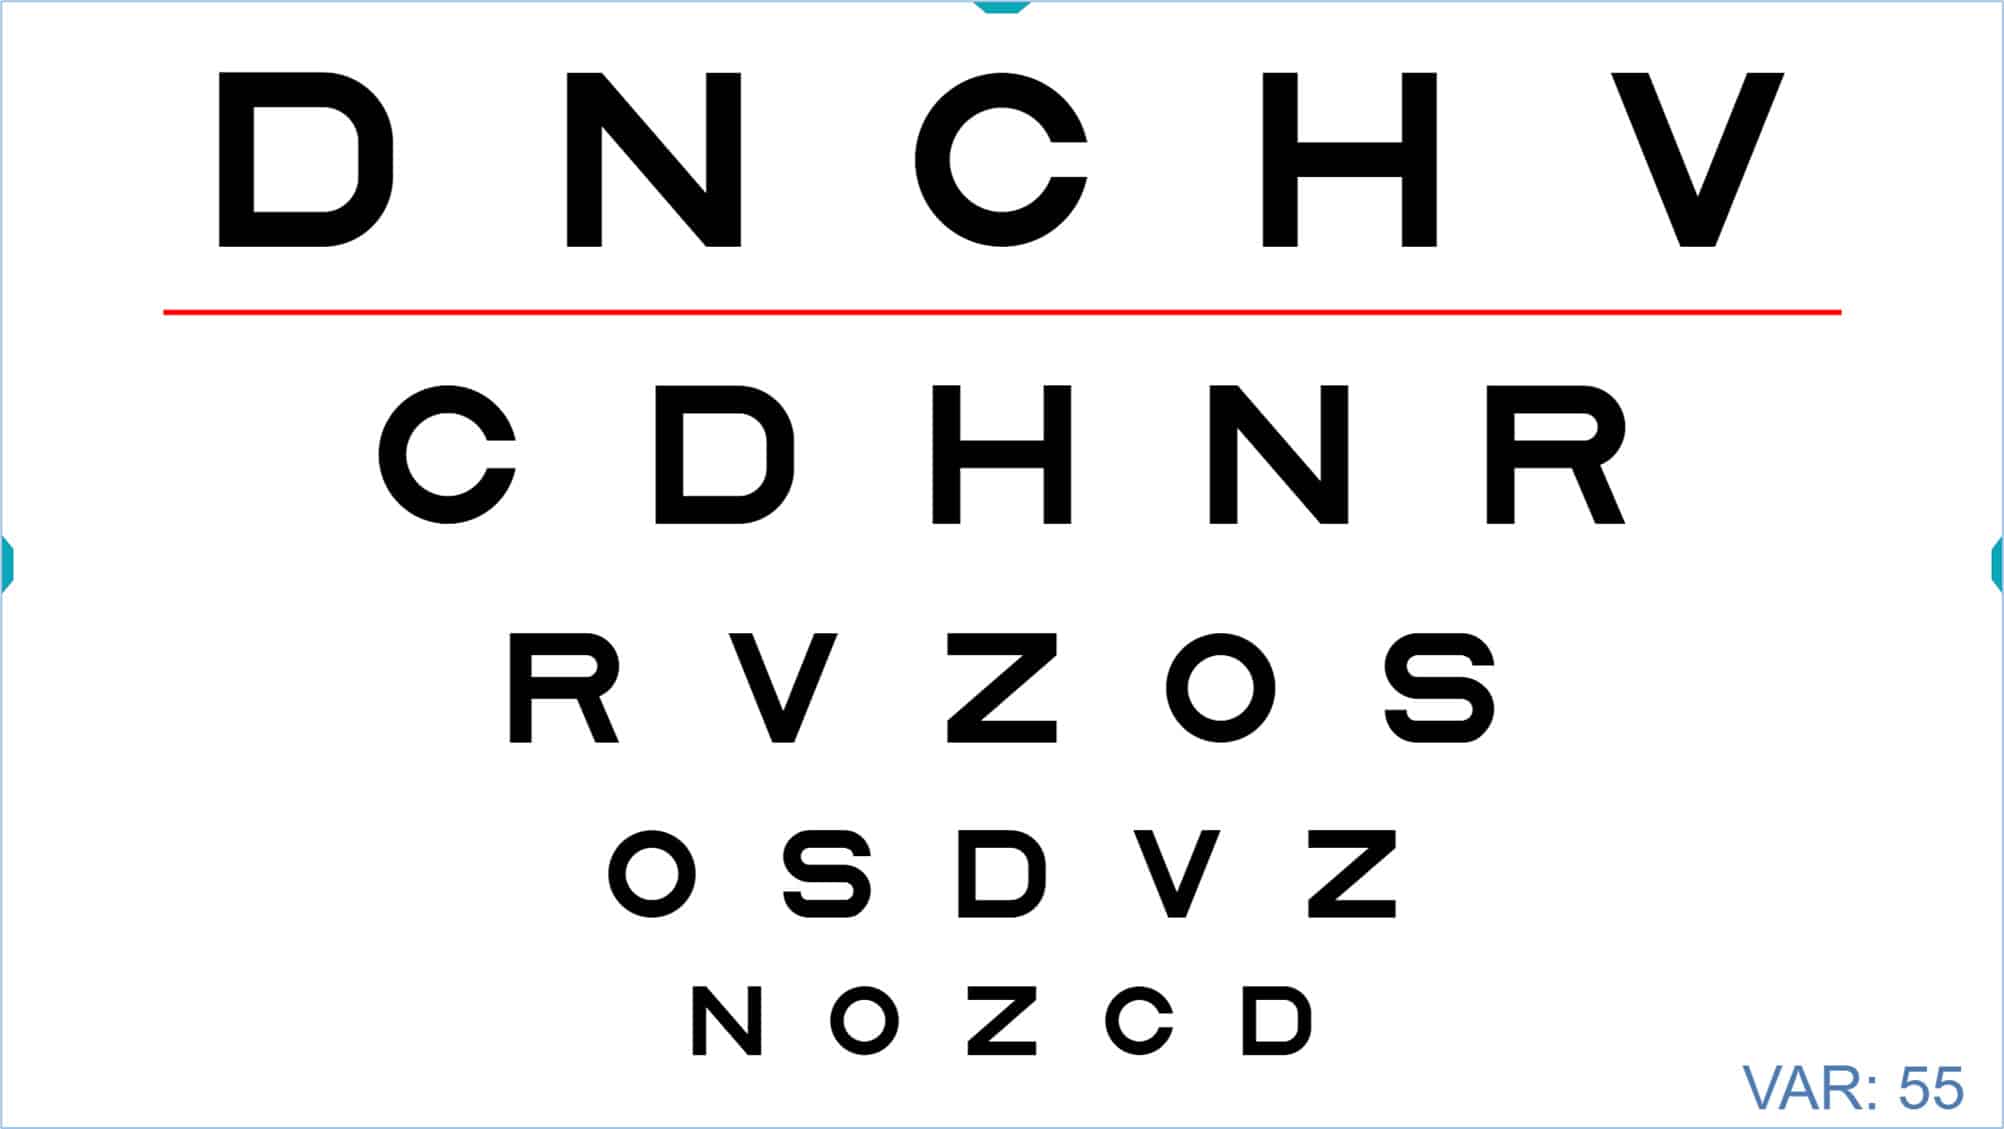
The acuity value of the selected row is displayed in the lower right corner of the screen. Acuity can be expressed in various notations: VAR (Visual Acuity Rating), Decimal, Snellen (in feet, commonly used in the United States), Snellen (in meters, typically used in the UK), millimetres* (representing the actual height of the letter on the screen), “M” notation, and finally logarithmic notation (log units). You can view the units for the acuity value by hovering the mouse over that number. In the image above, the VA is indicated in the initial VAR notation. To change the type of notation, repeatedly click on the numerical VA value, and the acuity value will cycle through the notations mentioned above. One more click will return you to the VAR notation. Alternatively, these changes can also be made by successively pressing the letter “W” on the keyboard.
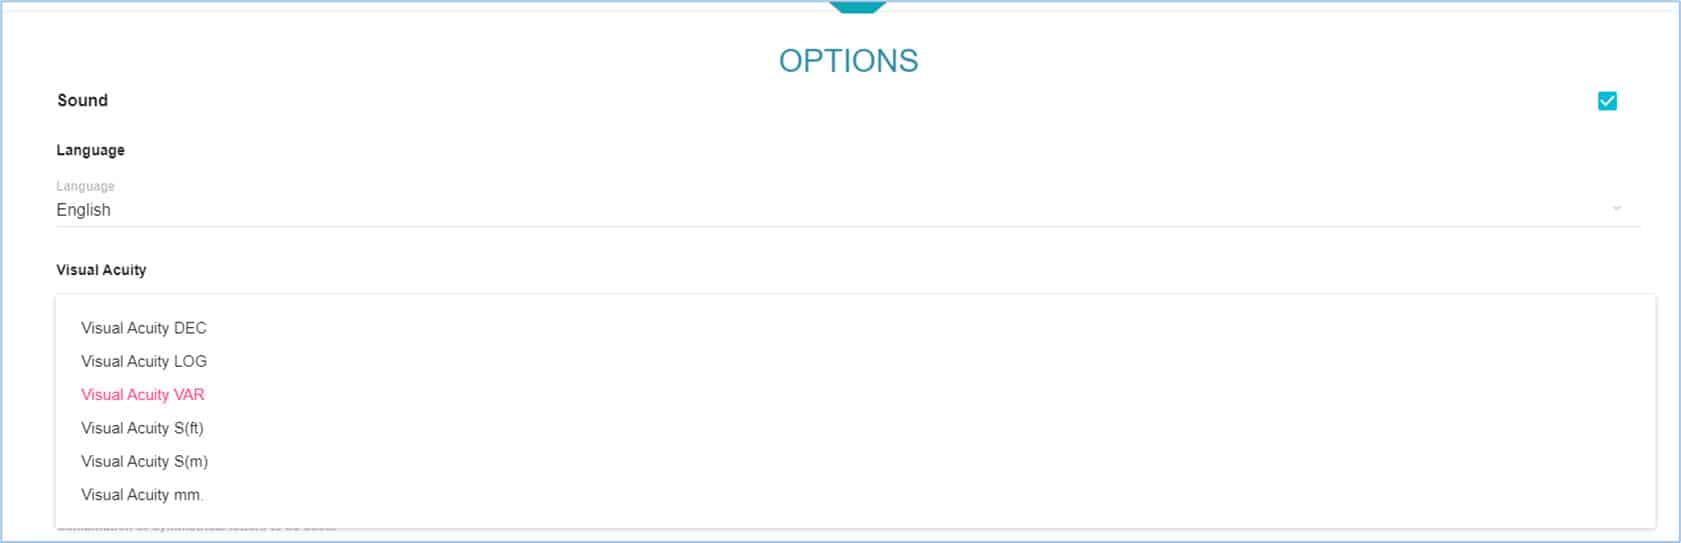
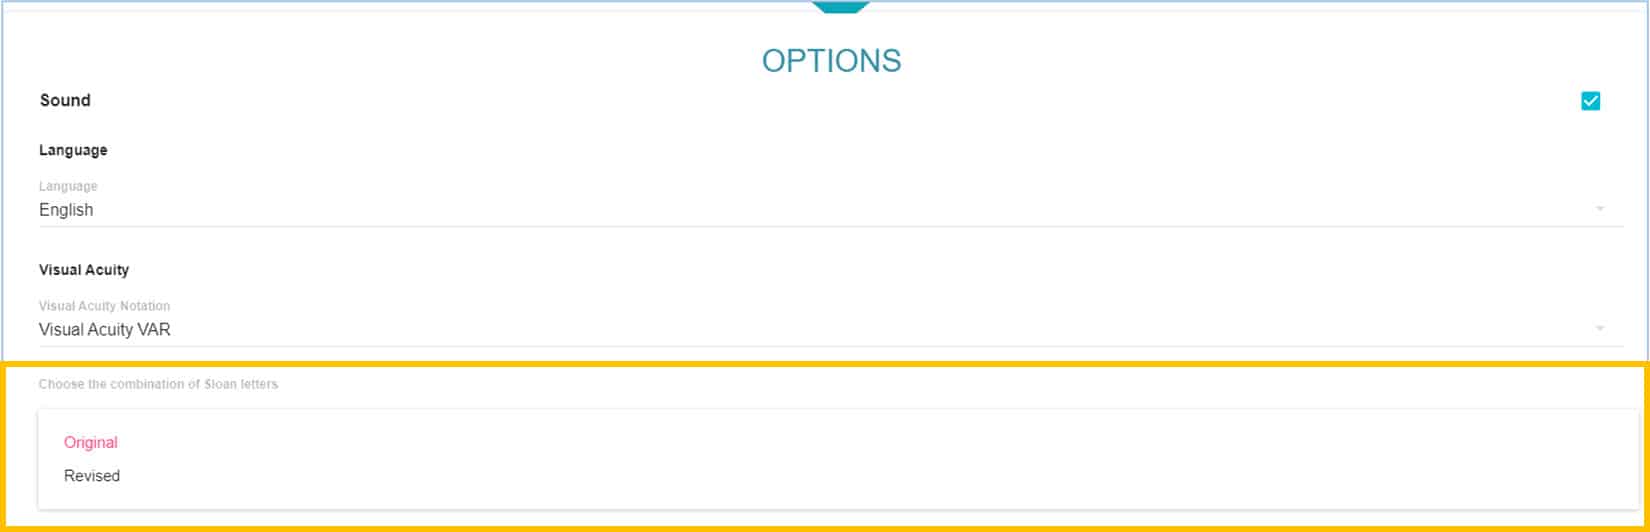
Remember that we can choose the initial notation that we want in the setup menu, in the section “Options”.
* The size in mm of the letters allows you to verify whether optotypes are perfectly calibrated for the test distance. Measure the height of the letter using a millimetre ruler to verify your calibration. If the error is greater than 2%, recalibration is advised.
Visual Acuity Range #
The smallest letters that can be displayed with the vision Unit correspond to a VA of 115 VAR (equivalent to 2.0 Decimal, 20/10 Snellen ft, 6/3 Snellen m, or -0.3 logMAR). The maximum letter size depends upon the monitor dimensions and the chosen viewing distance. For example, on a conventional 23-inch screen the maximum letter size would be a single letter of VA 20 VAR (equivalent to 0.025 Decimal, 20/800 Snellen ft, 6/240 Snellen m, or 1.60 log) for an observation distance of 4 meters.
A larger monitor might be capable of displaying a letter as large as VA -50 VAR (equivalent to 0.001 Decimal, 20/20,000 Snellen ft, 6/6,000 Snellen m, or 3.0 log).
When first opening a VA chart, the screen will display several rows of letters, the smallest being VA 100 VAR (equivalent to 1.0 Decimal, 20/20 Snellen ft, 6/6 Snellen m, or 0.0 log).
The default range of sizes includes the 100 VAR (20/20, 6/6) line and larger sizes, with the number of lines and largest size determined by the dimensions of the monitor. Smaller letters are only shown when the examiner wants to measure a threshold in patients with good acuity. In this way, other patients will not be upset because they are not able to read very small letters that might be present on a printed chart. Using the computerized chart allows the examiner to tailor the display for the individual patient.
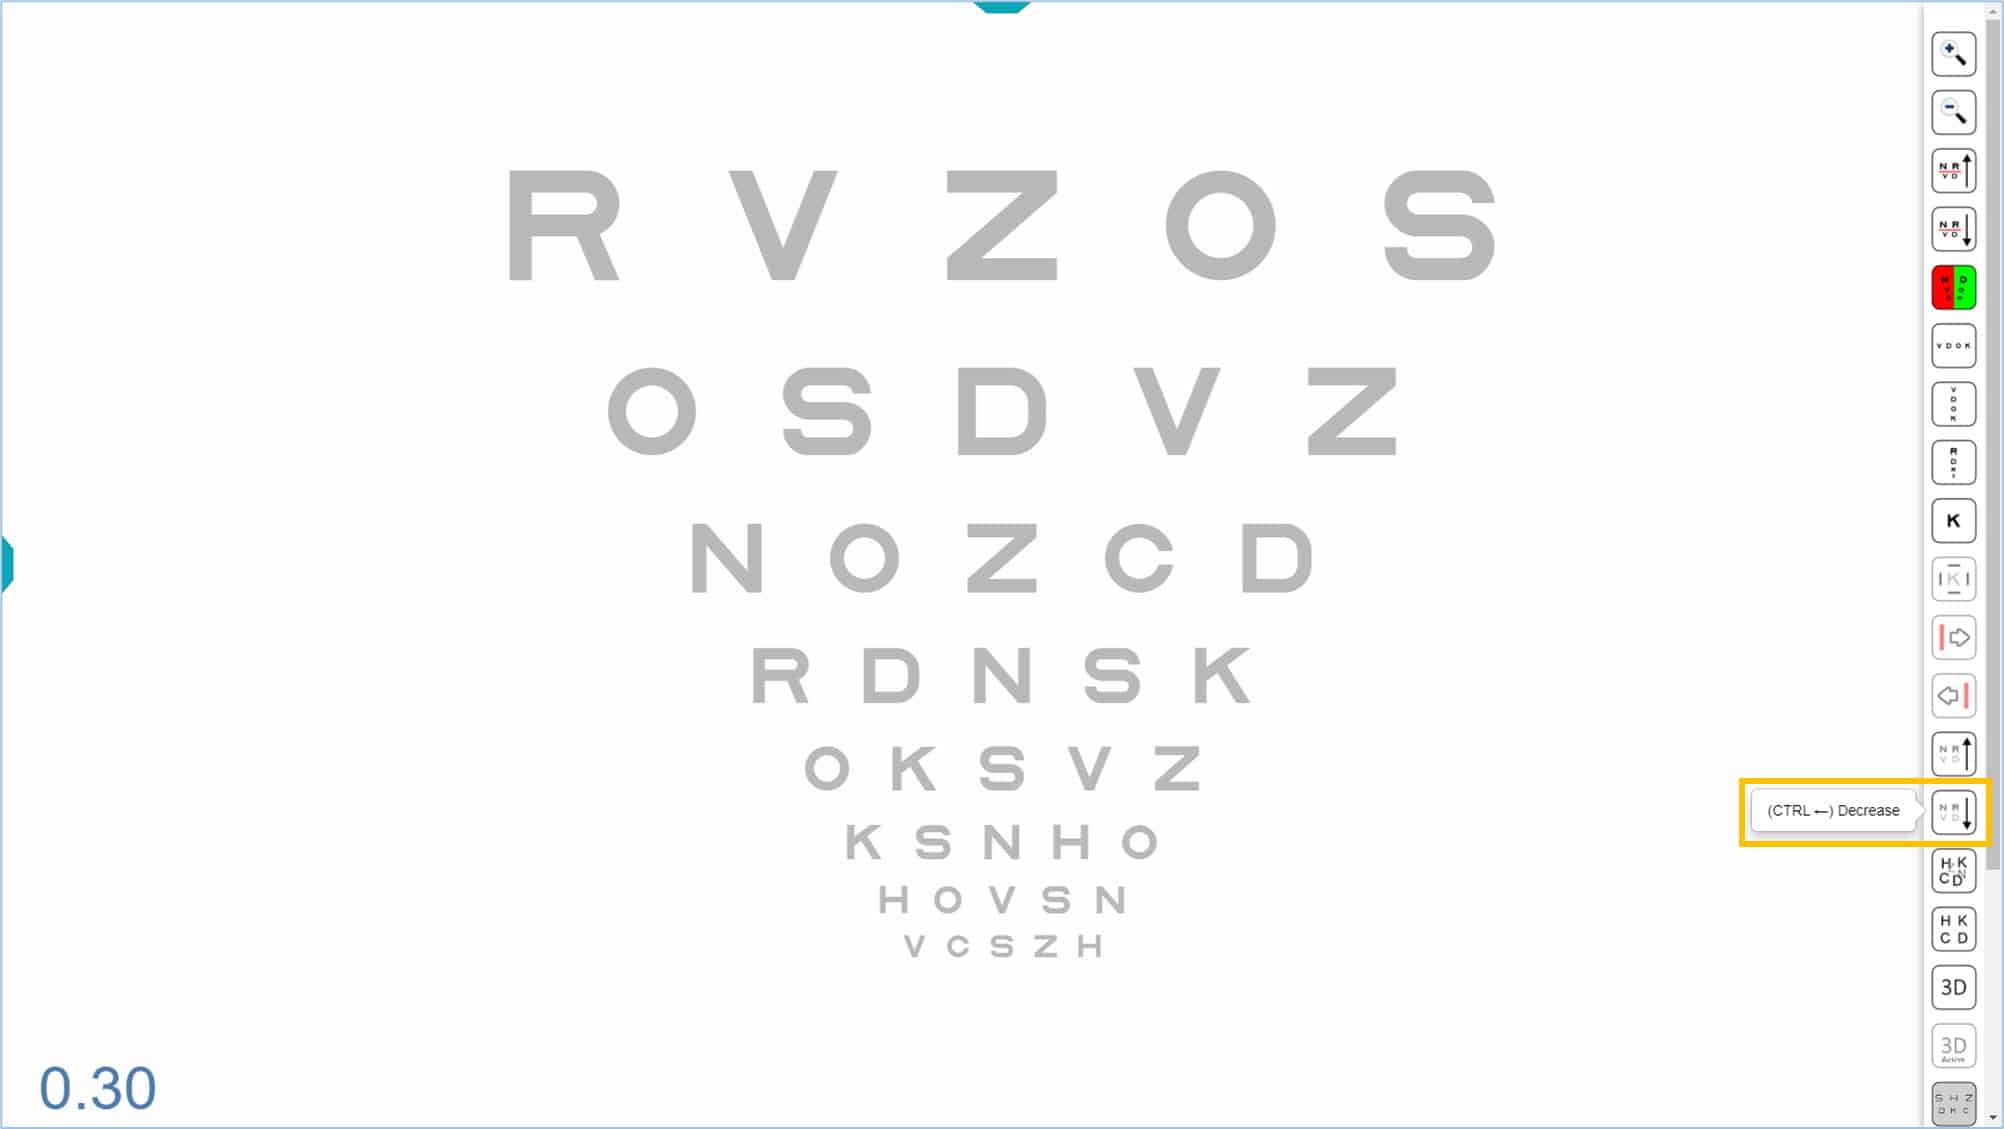
The size of the letters can be increased and decreased through the corresponding icons in the Tools Menu.


Each time you click the icon with the “+” sign, the next row with larger letters is added at the top (and the smaller rows that do not fit at the bottom of the screen disappear). When you click the icon with the “-” sign, a new row with smaller letters is added at the bottom (and the larger rows that do not fit on the top disappear).
Bi-Chrome Function #
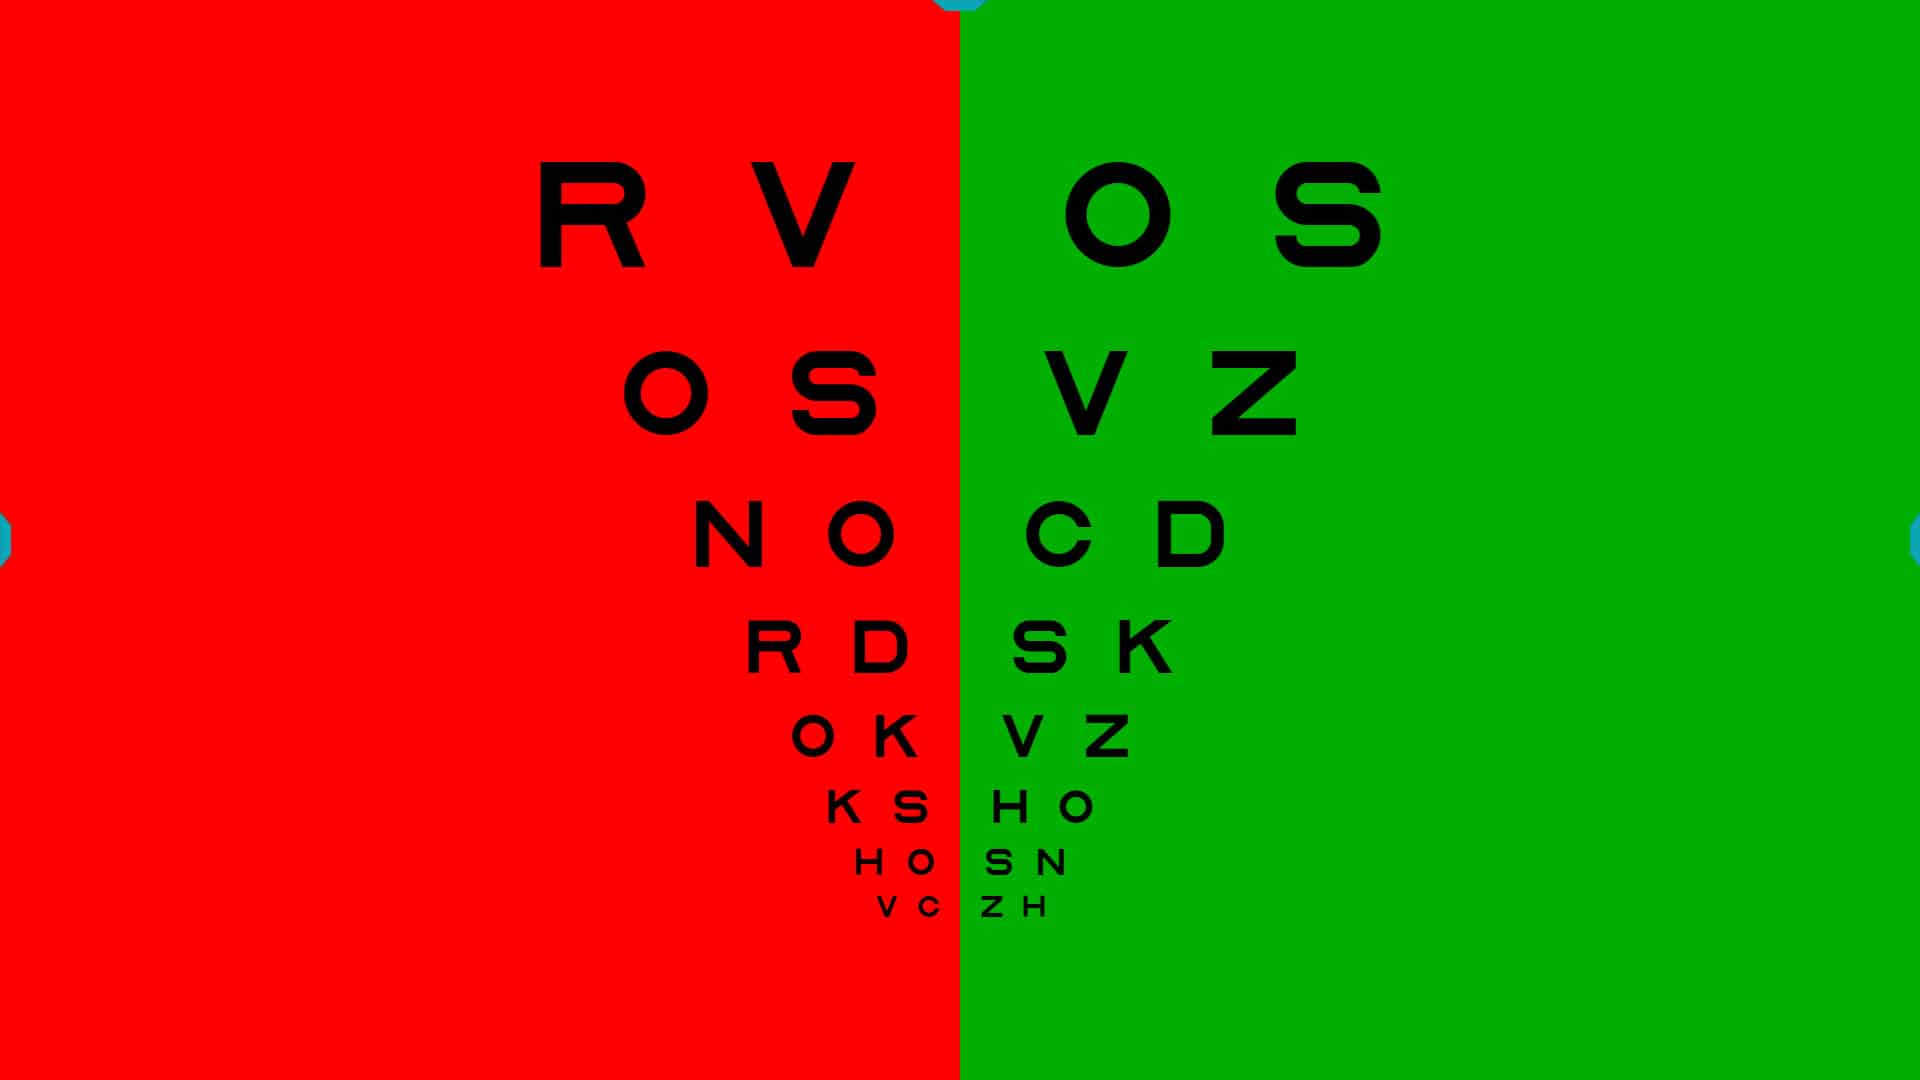
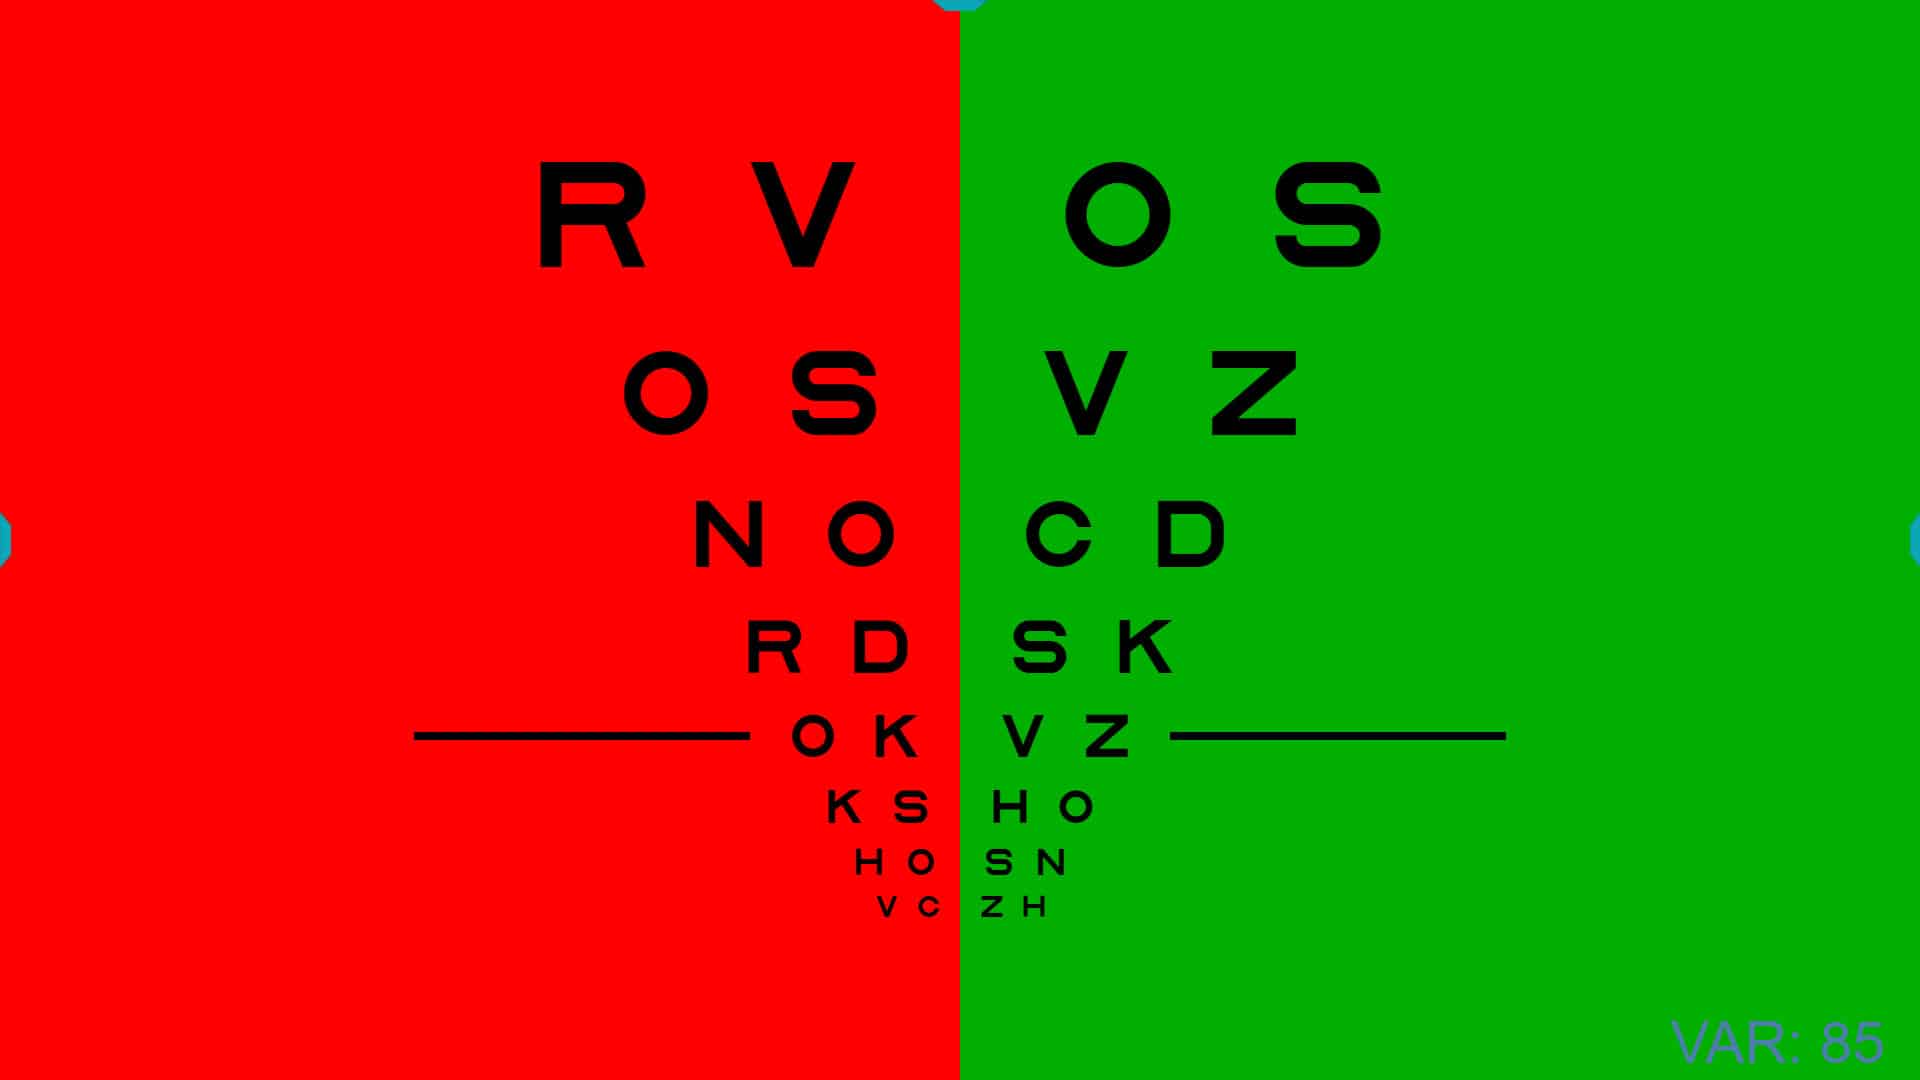
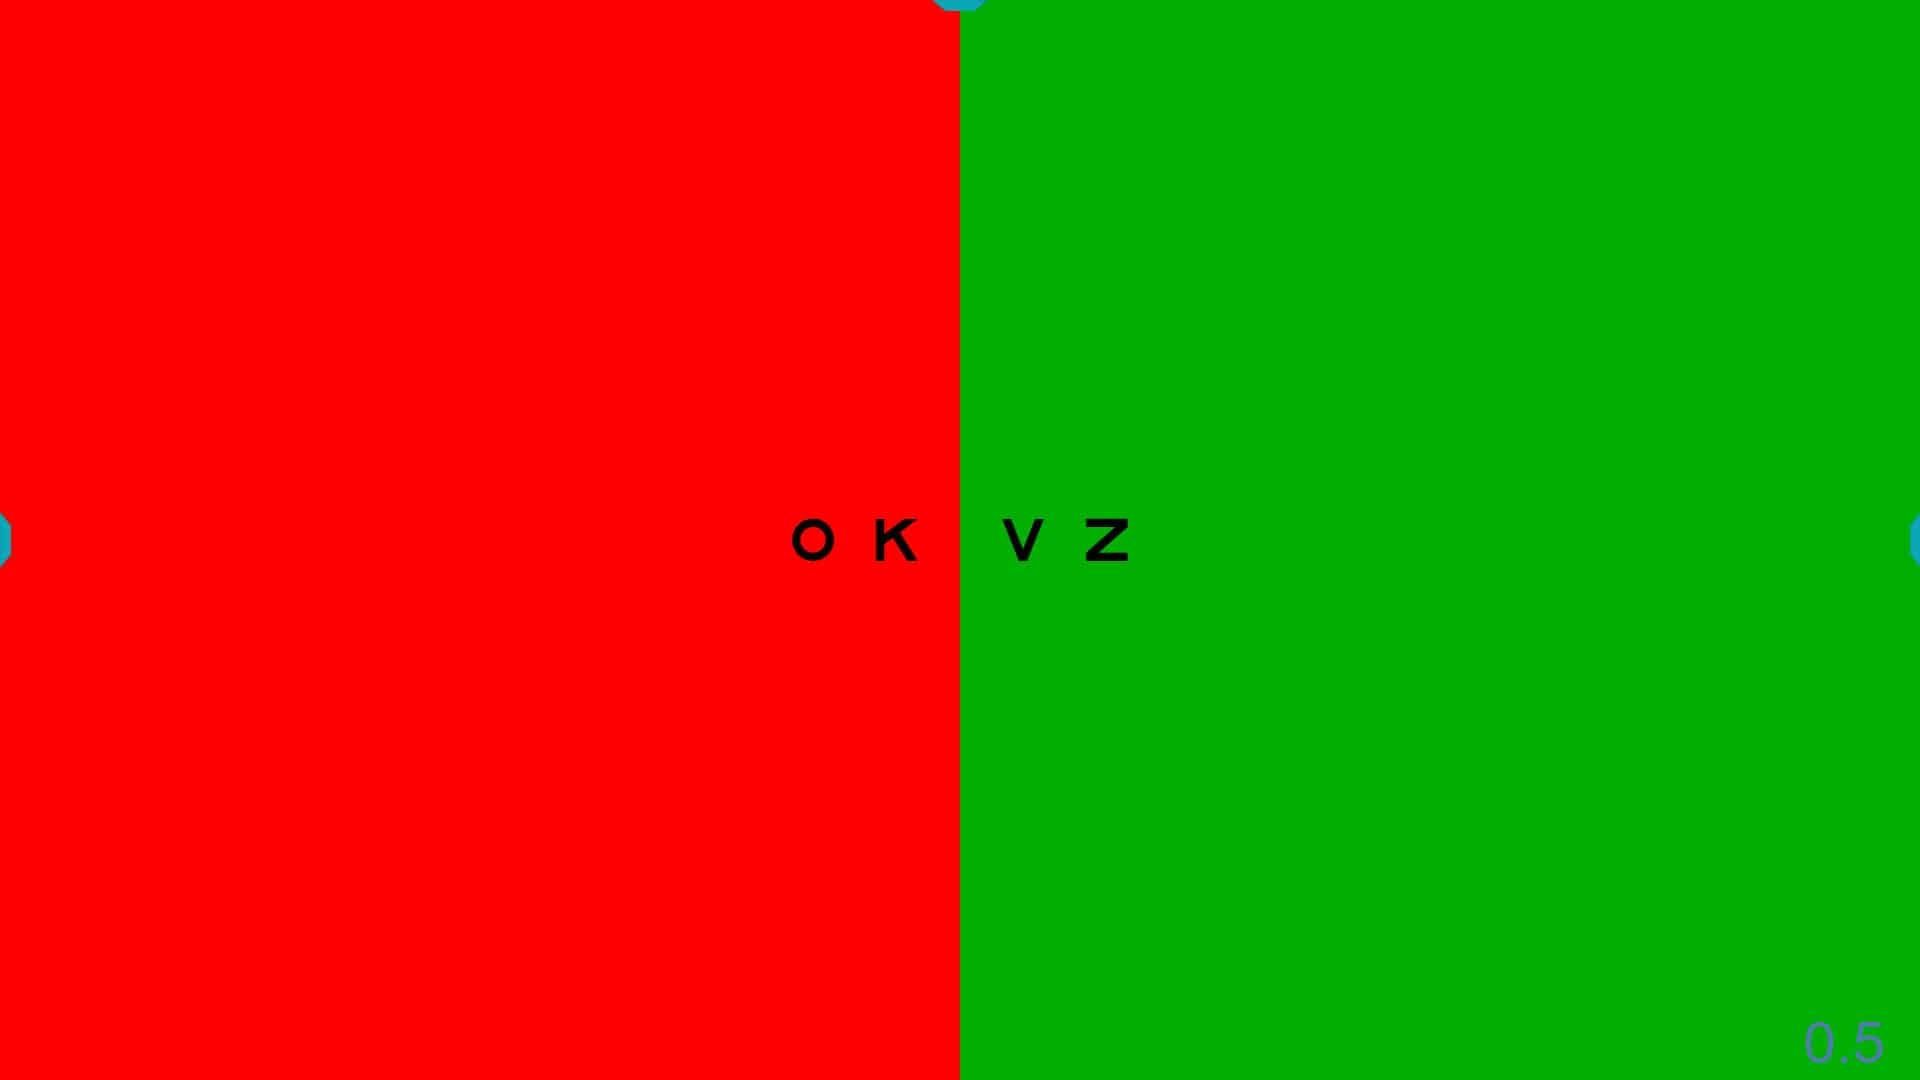
Any of the charts can be adapted for the bichromatic test by changing the background to red and green. First, open the desired chart, then show the tools menu and click the red and green icon (or type keyboard shortcut “B”). When you activate the bichromatic option, the first half of the chart will be displayed on a red background, the second half will be green, and the central column will be removed.
With the bichromatic mask in place, all the functions of the Tools Menu may be used as before. For example, the same steps described above may be used to increase or decrease the size of the letters. You may also select a particular row, which will be indicated by a black line, while using the bichromatic function. To remove the bichromatic mask, click the icon (or type “B”) and the chart will return to its original display.
Isolated Optotypes (Rows, Columns, and Letters) #
Rows #
The program has a very useful function that allows the user to isolate a horizontal row in any of the VA charts. This function is used to reduce crowding from neighbouring rows, and to help the patient concentrate on the desired row during a subjective refraction.
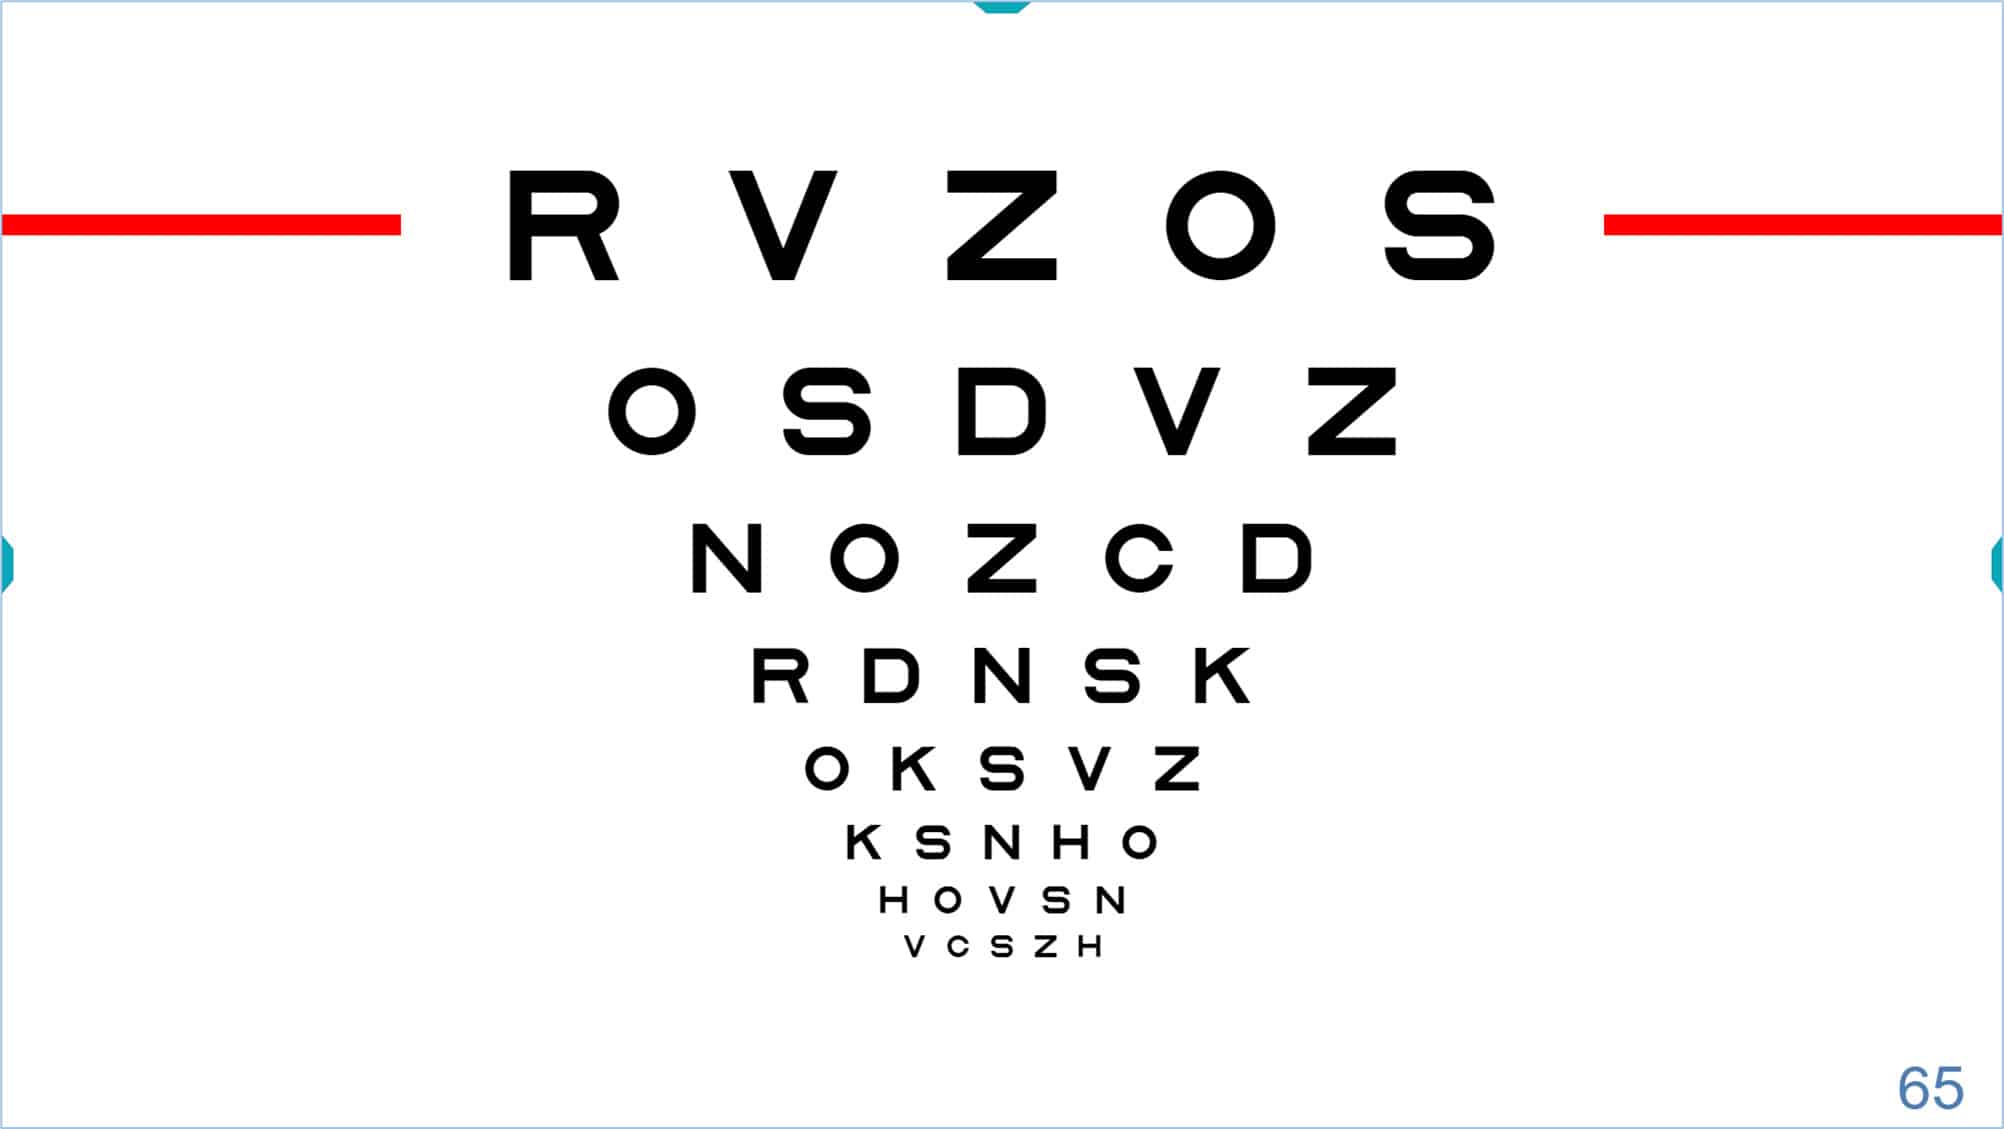
To isolate a row, press the tools menu icon or the “R” (or “Enter”) on the keyboard. The displayed row always defaults to a VA of 85 VAR (0.5 Dec, 20/40, 6/12), as shown in the lower right corner of the screen.
![]()
Once the row is isolated, you may change its size by clicking on the icons of the tools menu. Alternatively, type “+” or “-”, or use the arrow keys to increase (up arrow ↑) or decrease (down arrow ↓) the size. The updated acuity value will be displayed in the lower right corner.

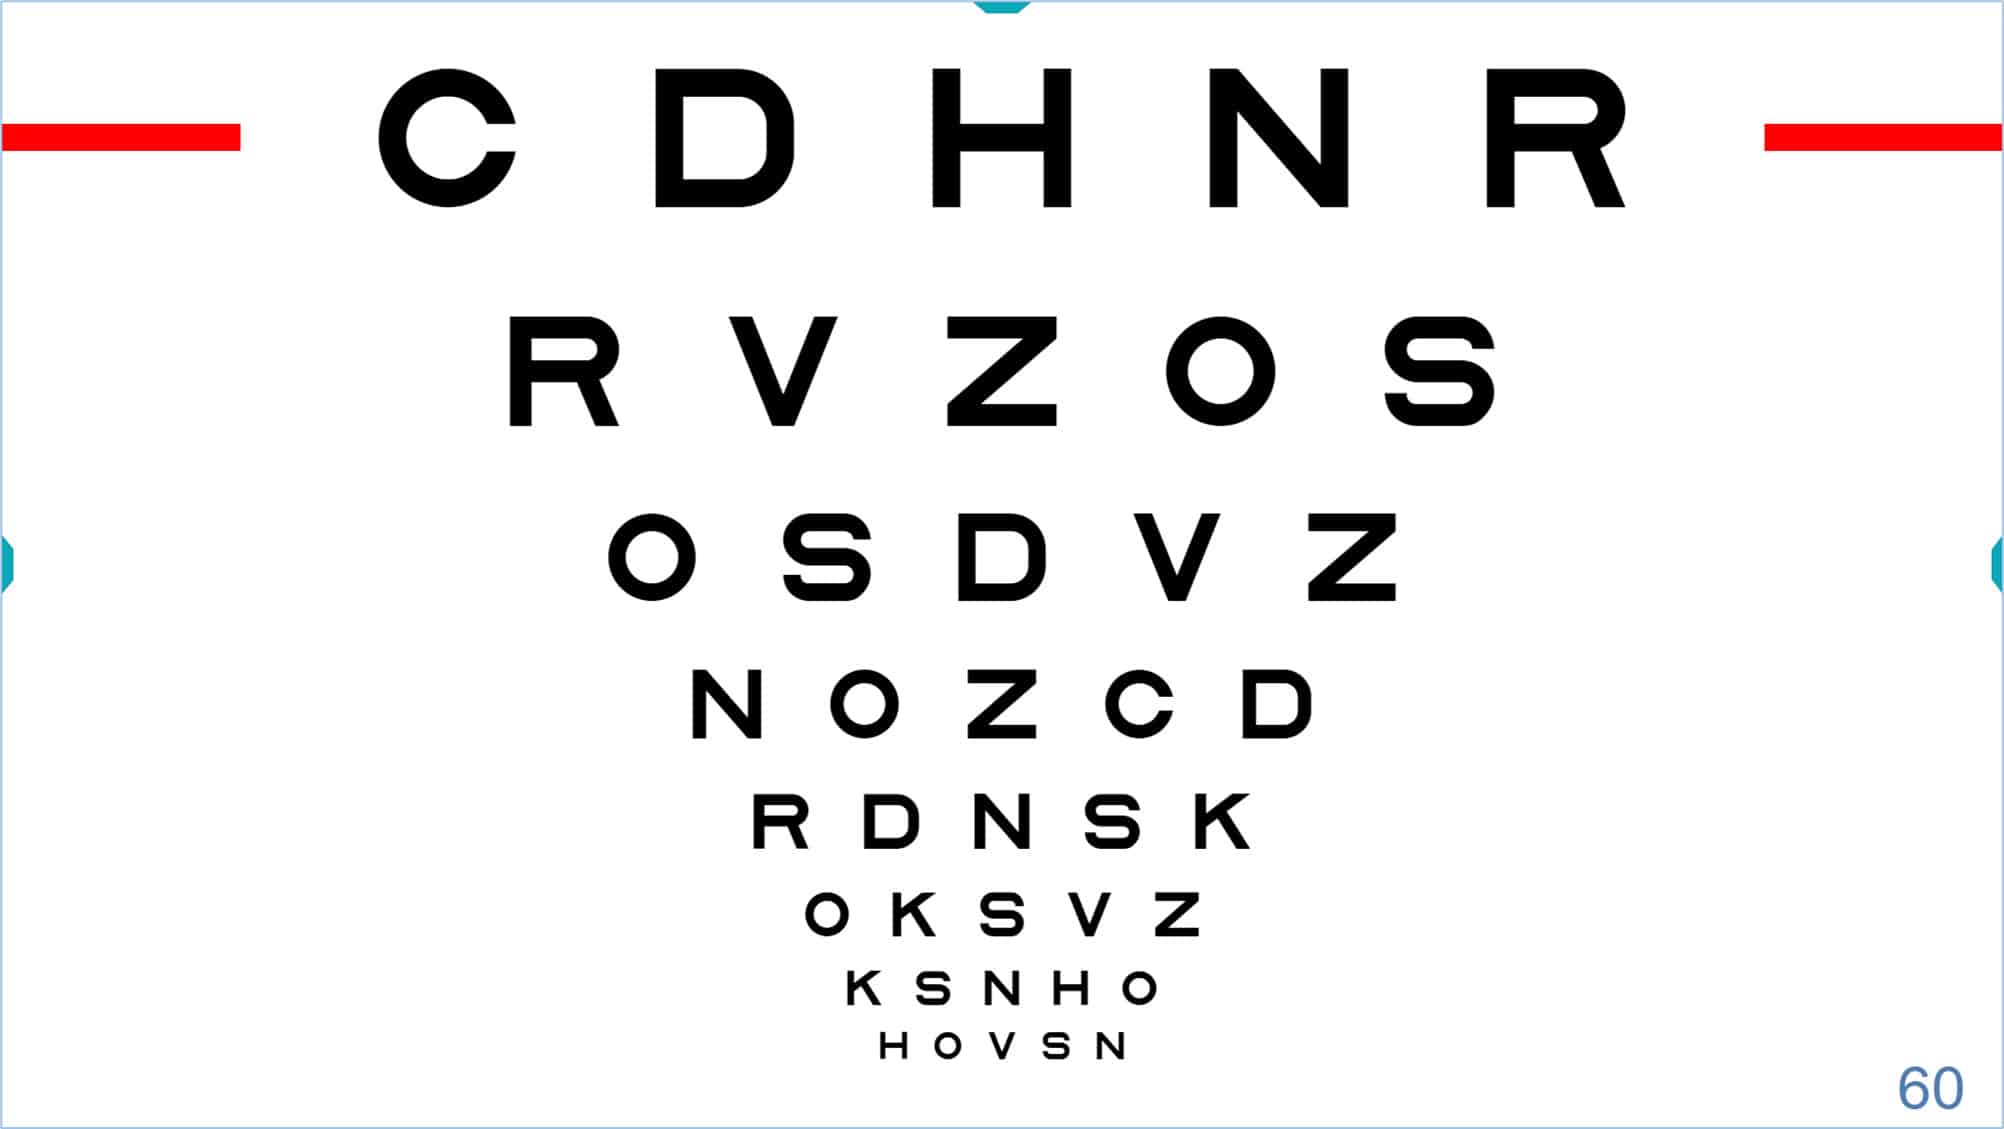
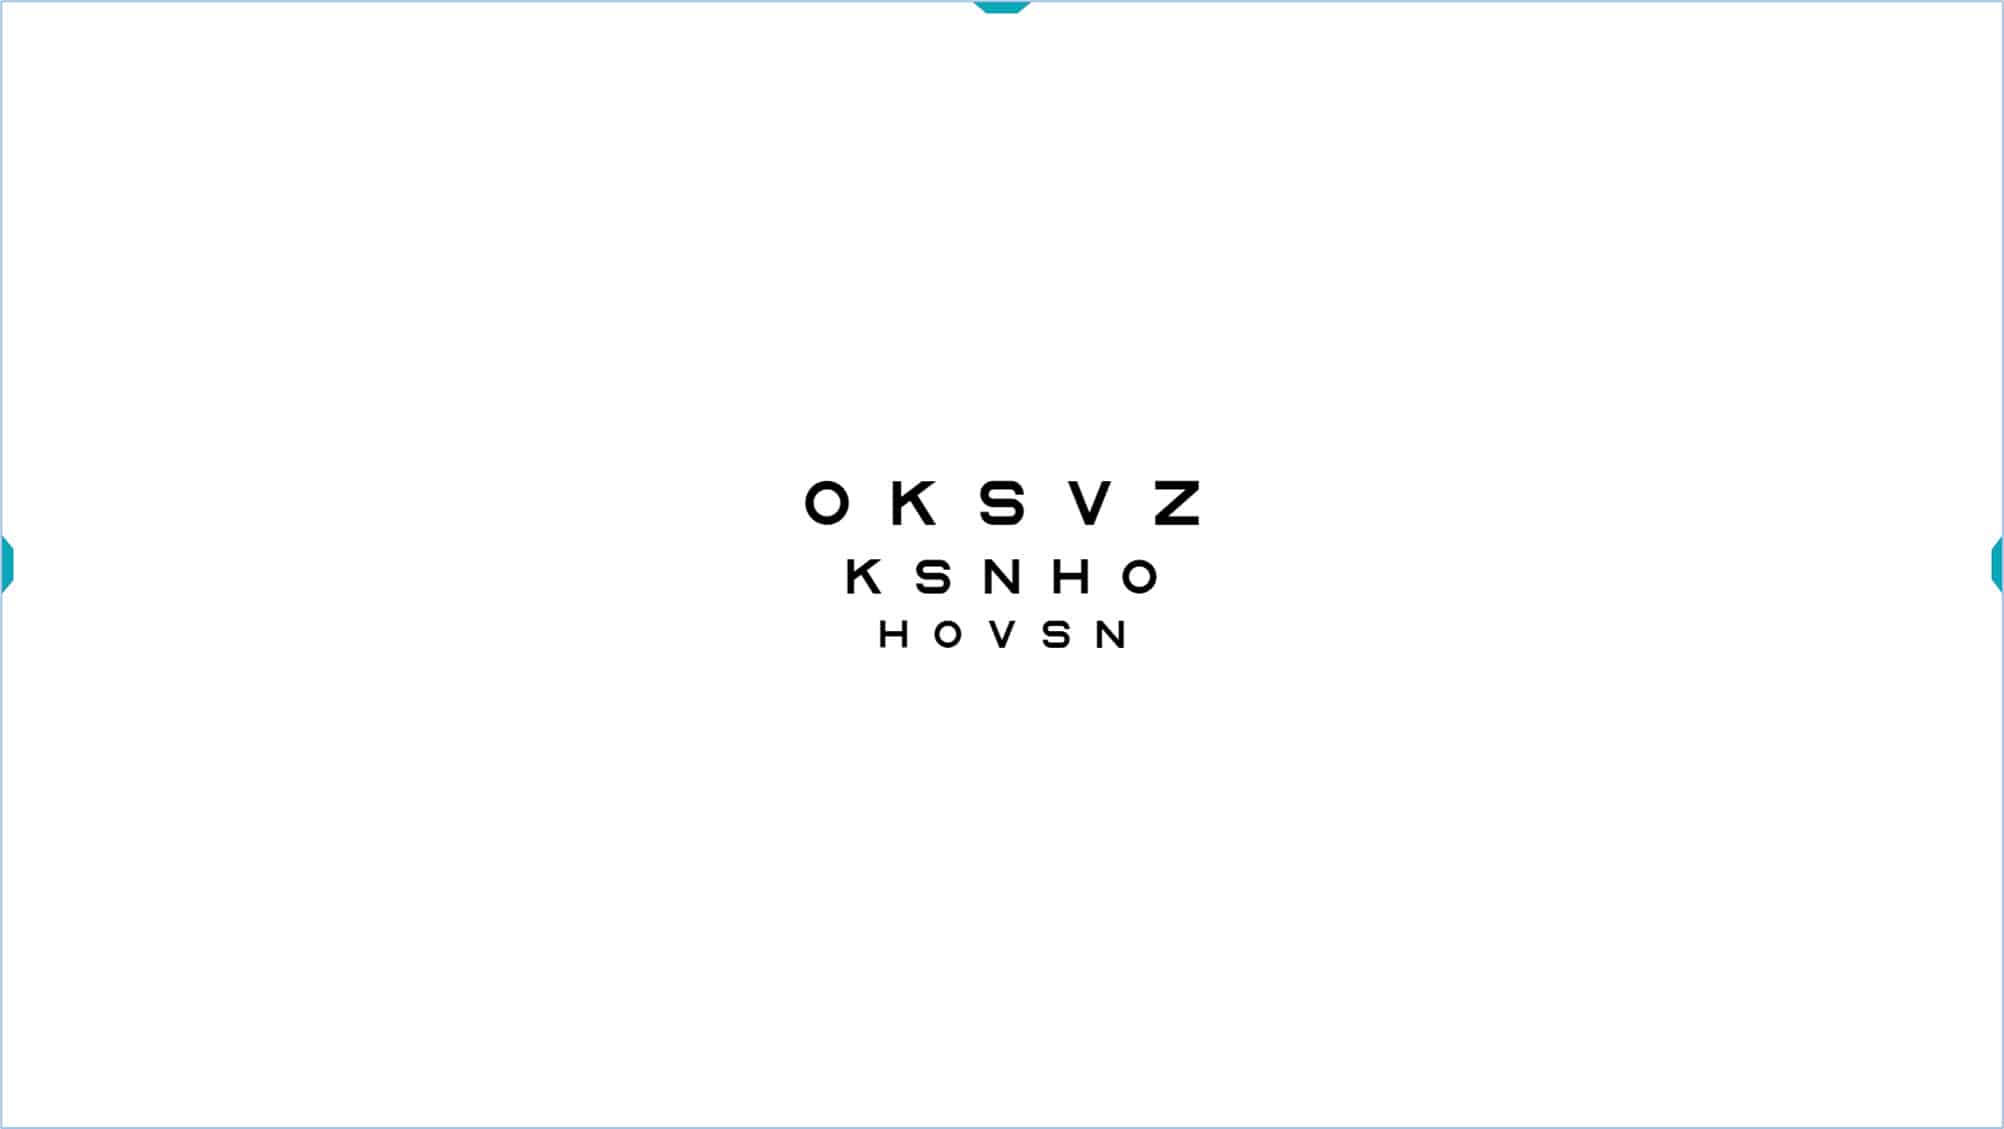
The single row icon has another very interesting function. If you click the icon again (or type “R”/“Enter”/“OK”) a new line of smaller letters is added underneath (and the larger row is maintained). Each time you click the row icon (or type “R”/“Enter”/“OK”) a new smaller row appears, until you fill the screen. This strategy allows you to “isolate” (or indicate) any number of lines, and then resize them using the keys (“+” or “-”) or indicate a different row using the ↑ or ↓ arrows.
This function can speed up comparisons of acuity with and without correction, or when adjusting power to find the best sphere during subjective refraction. It can also be used to verify that the patient is able to read a new line as the spherical power is increased.
In general, the final acuity measurement should be taken with the chart fully displayed. Otherwise, falsely high acuity values may be obtained from isolated letters or rows due to reduced contour interaction and crowding. Different testing conditions can change the threshold, making it difficult to compare results with other visits or professionals. In addition, it is always advisable to encourage the patient to try to guess the letters when they are near their acuity threshold.
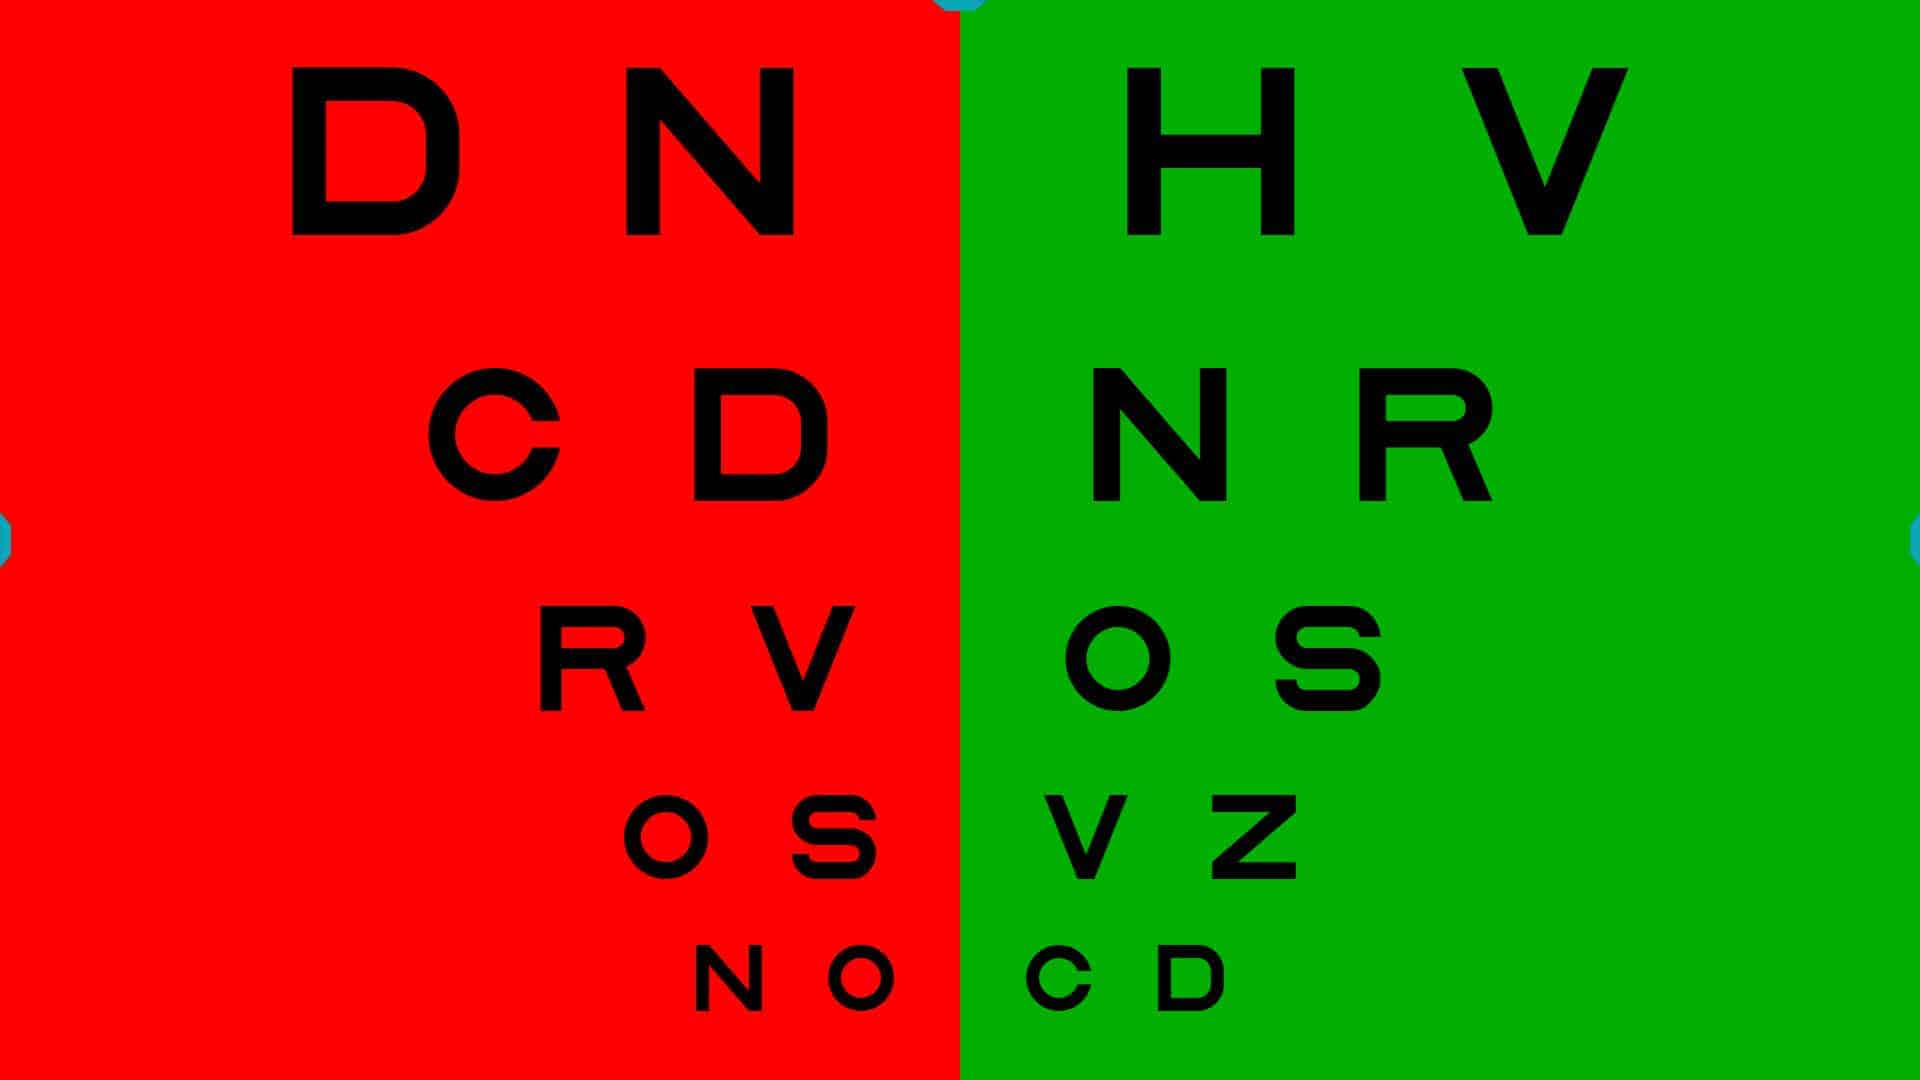
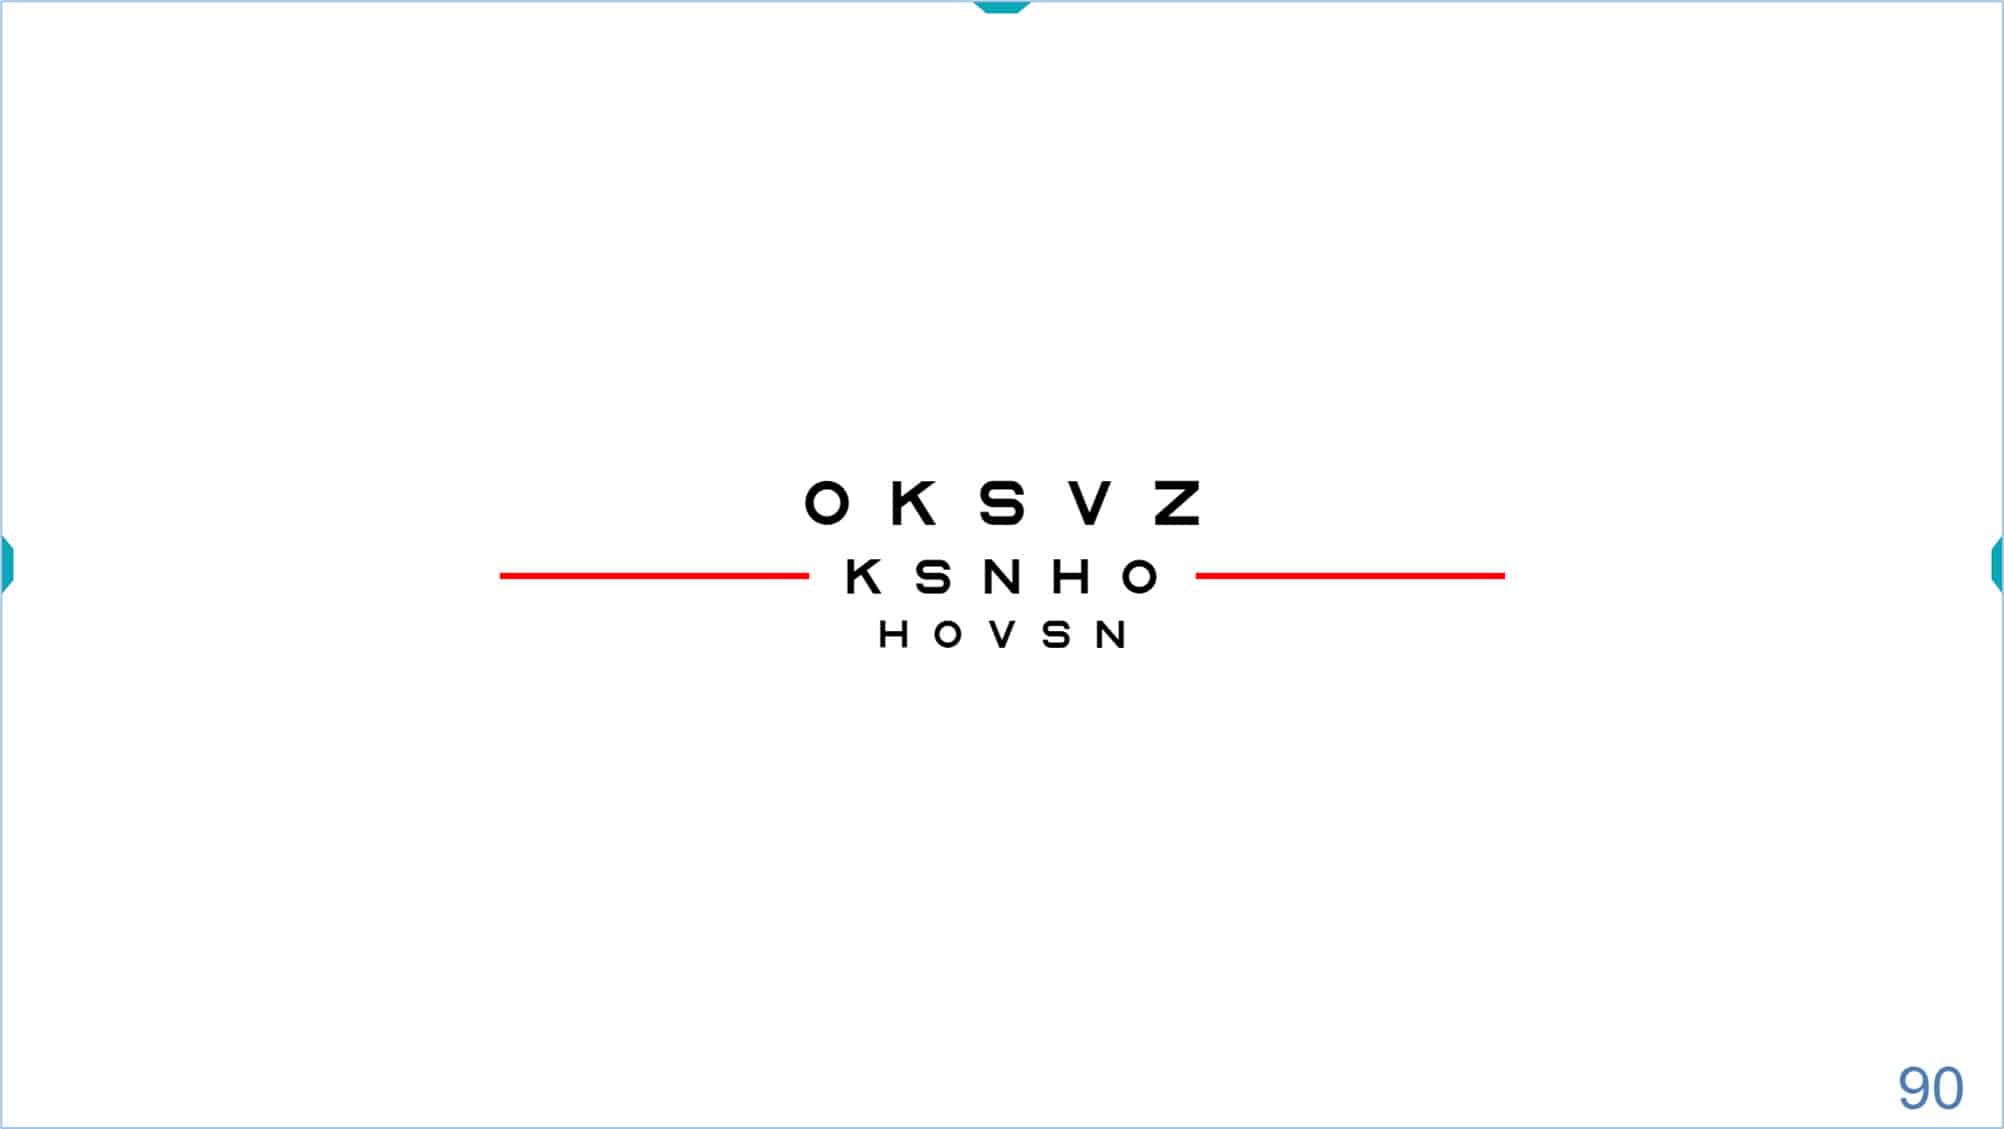
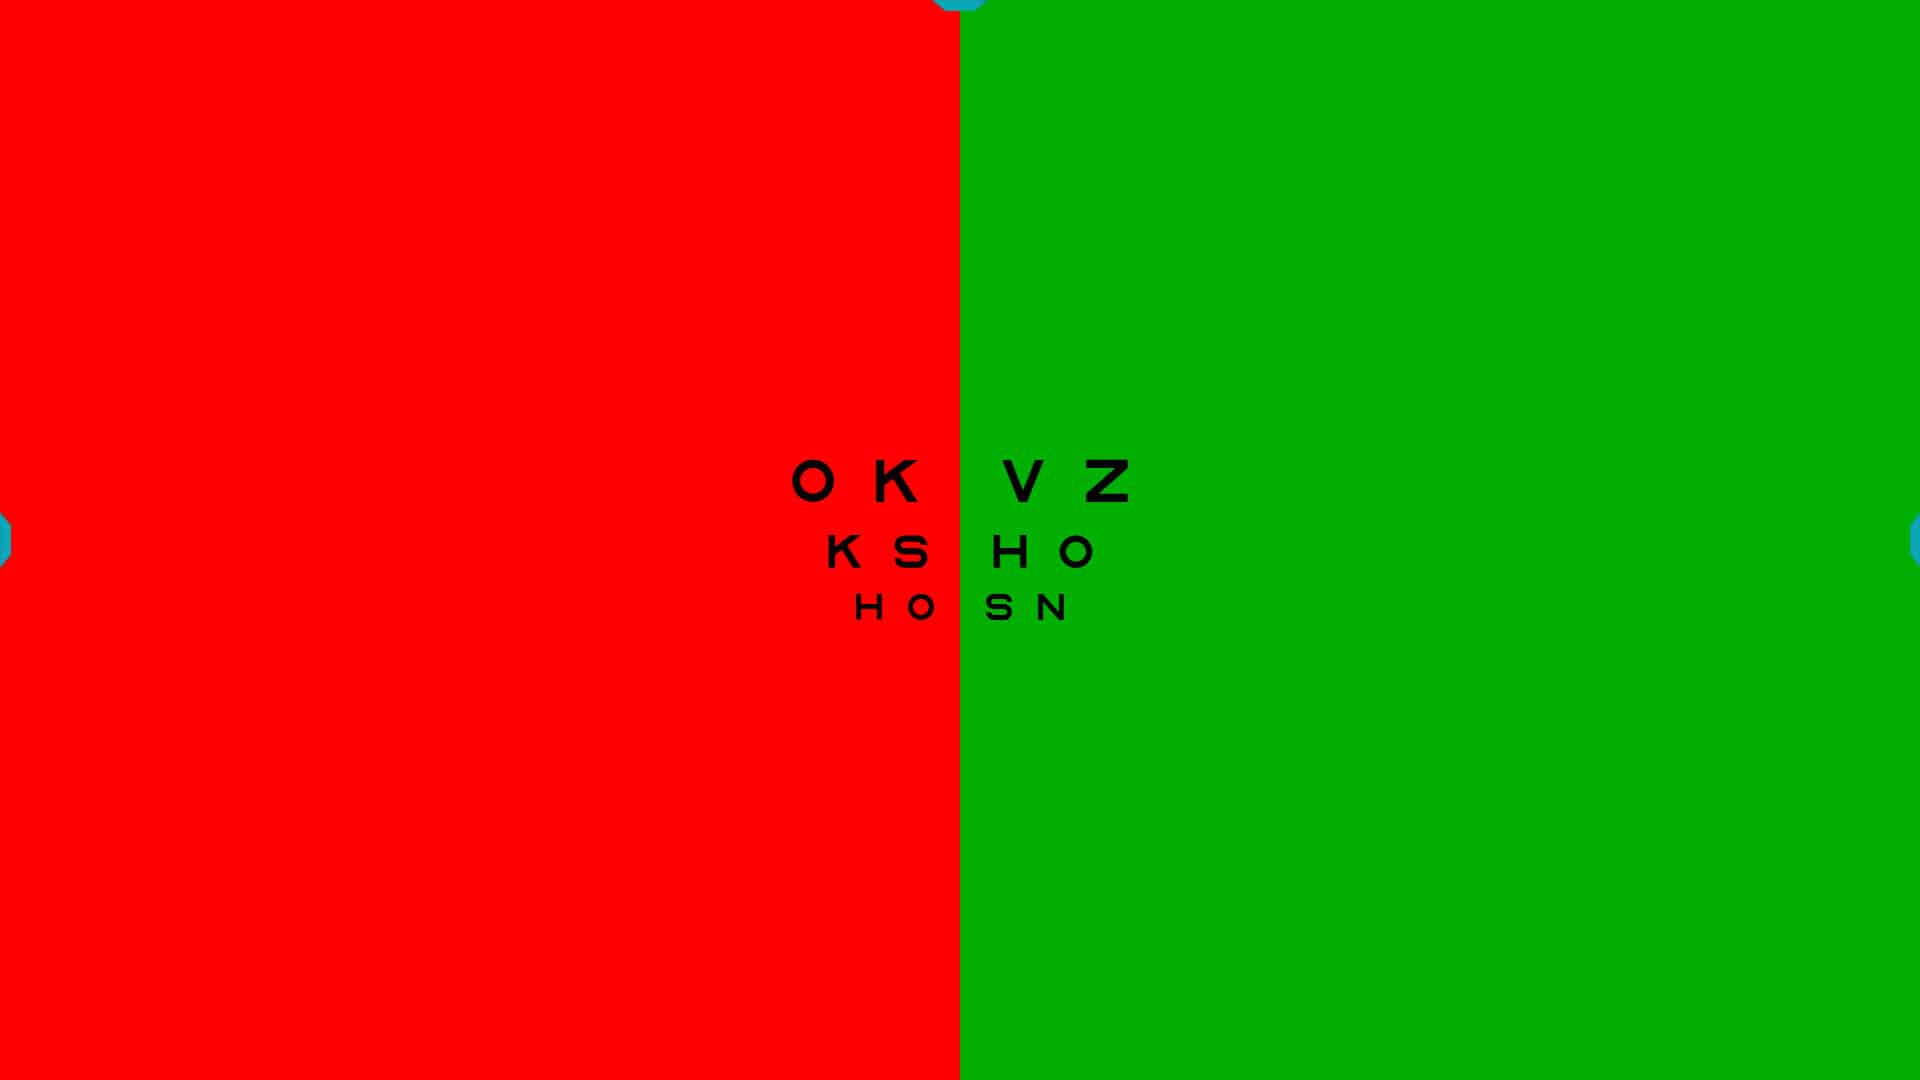
The bichromatic mask can also be applied to the selection of rows, as shown below.
 |
 |
Contour Interaction #
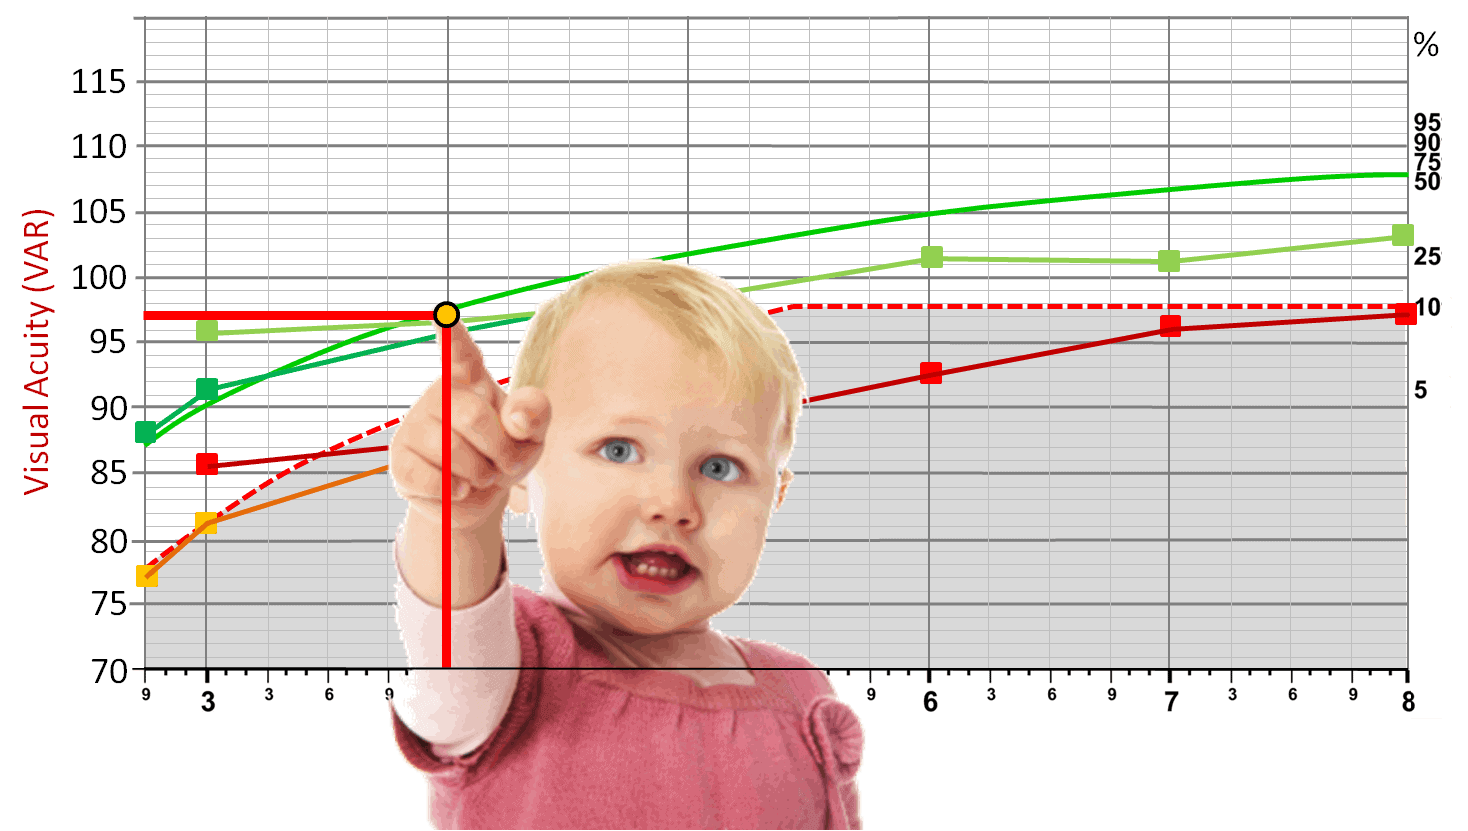
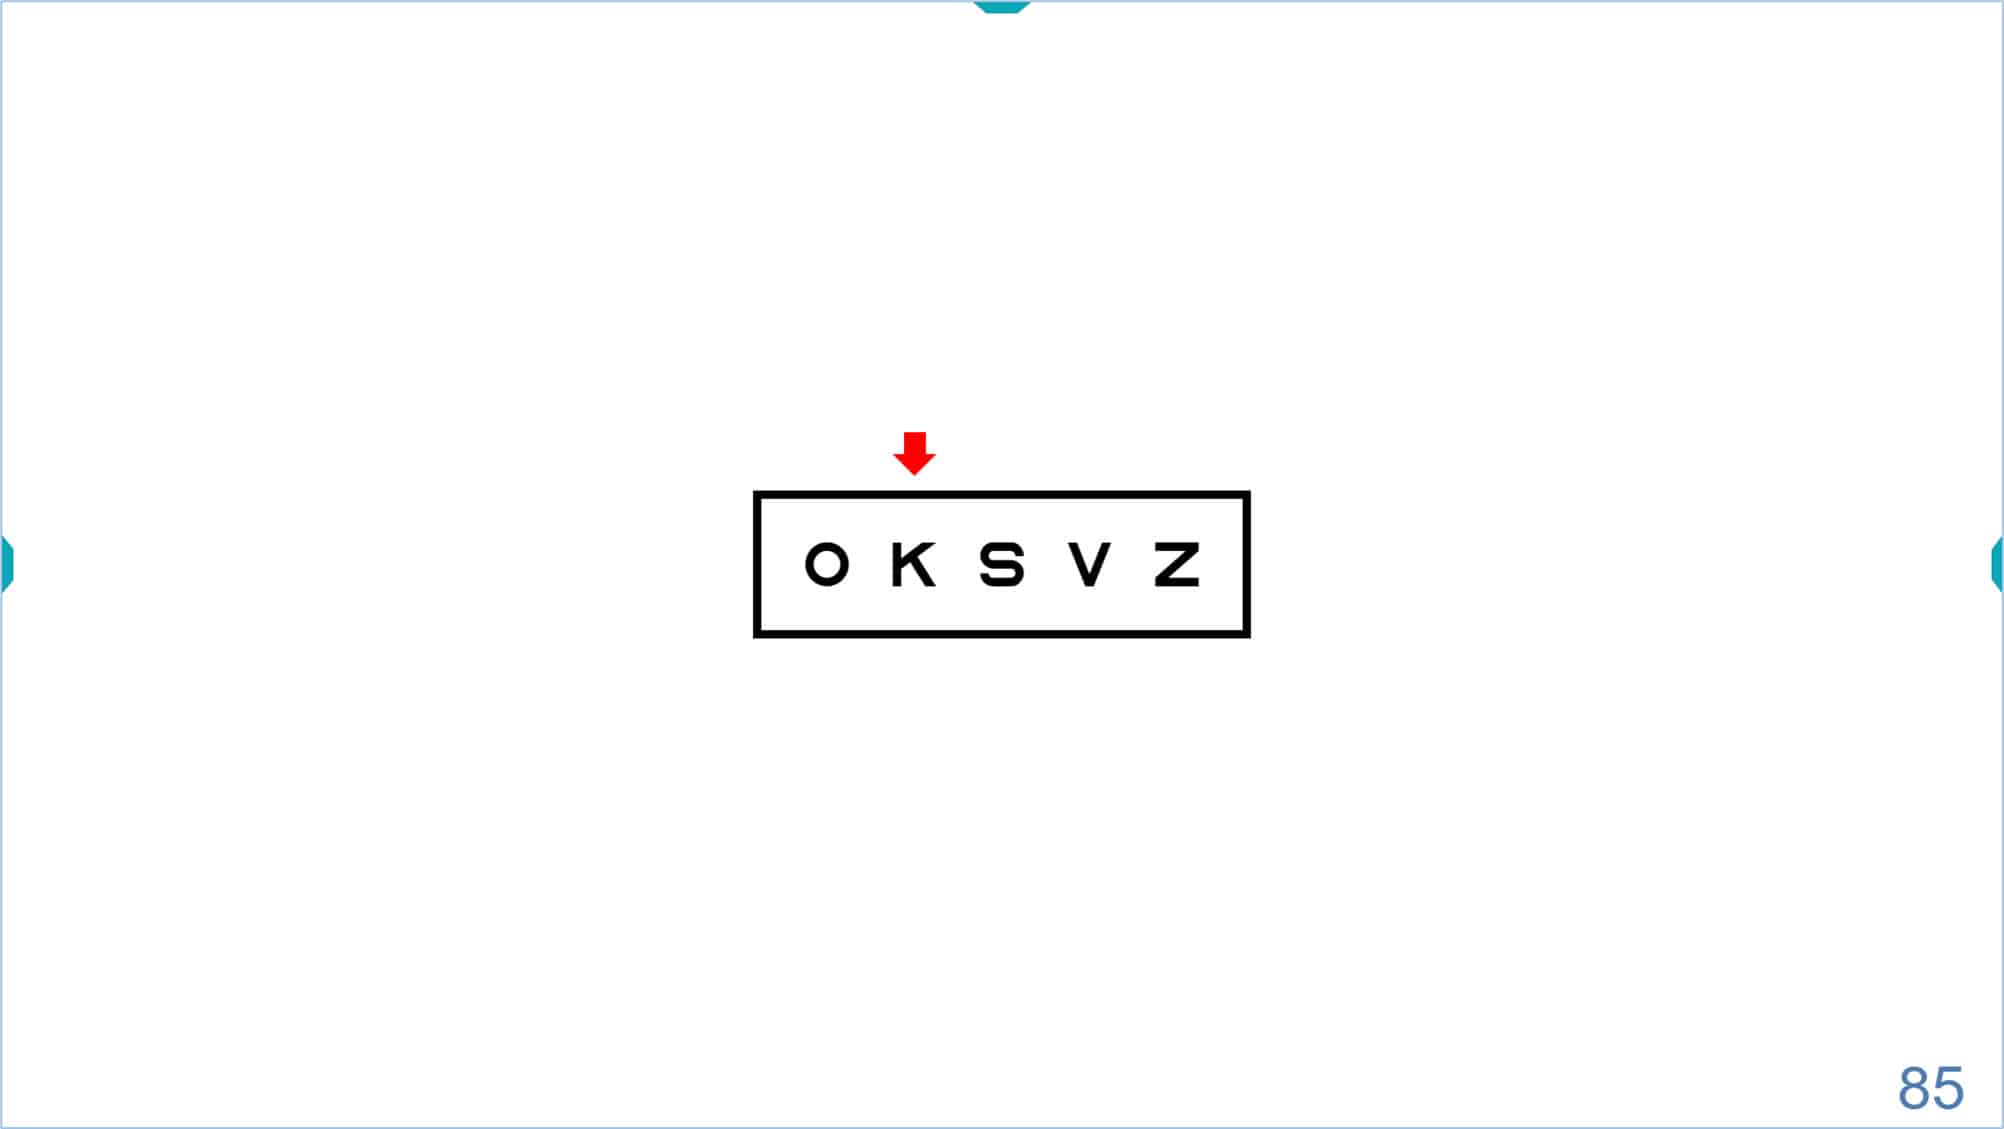
Sometimes, it may be beneficial to display a row of letters or symbols surrounded by contour interaction bars. This can be particularly useful, for instance, in better detecting the presence of amblyopia in younger children or when performing Visual Acuity (VA) Percentile Curves. (3)
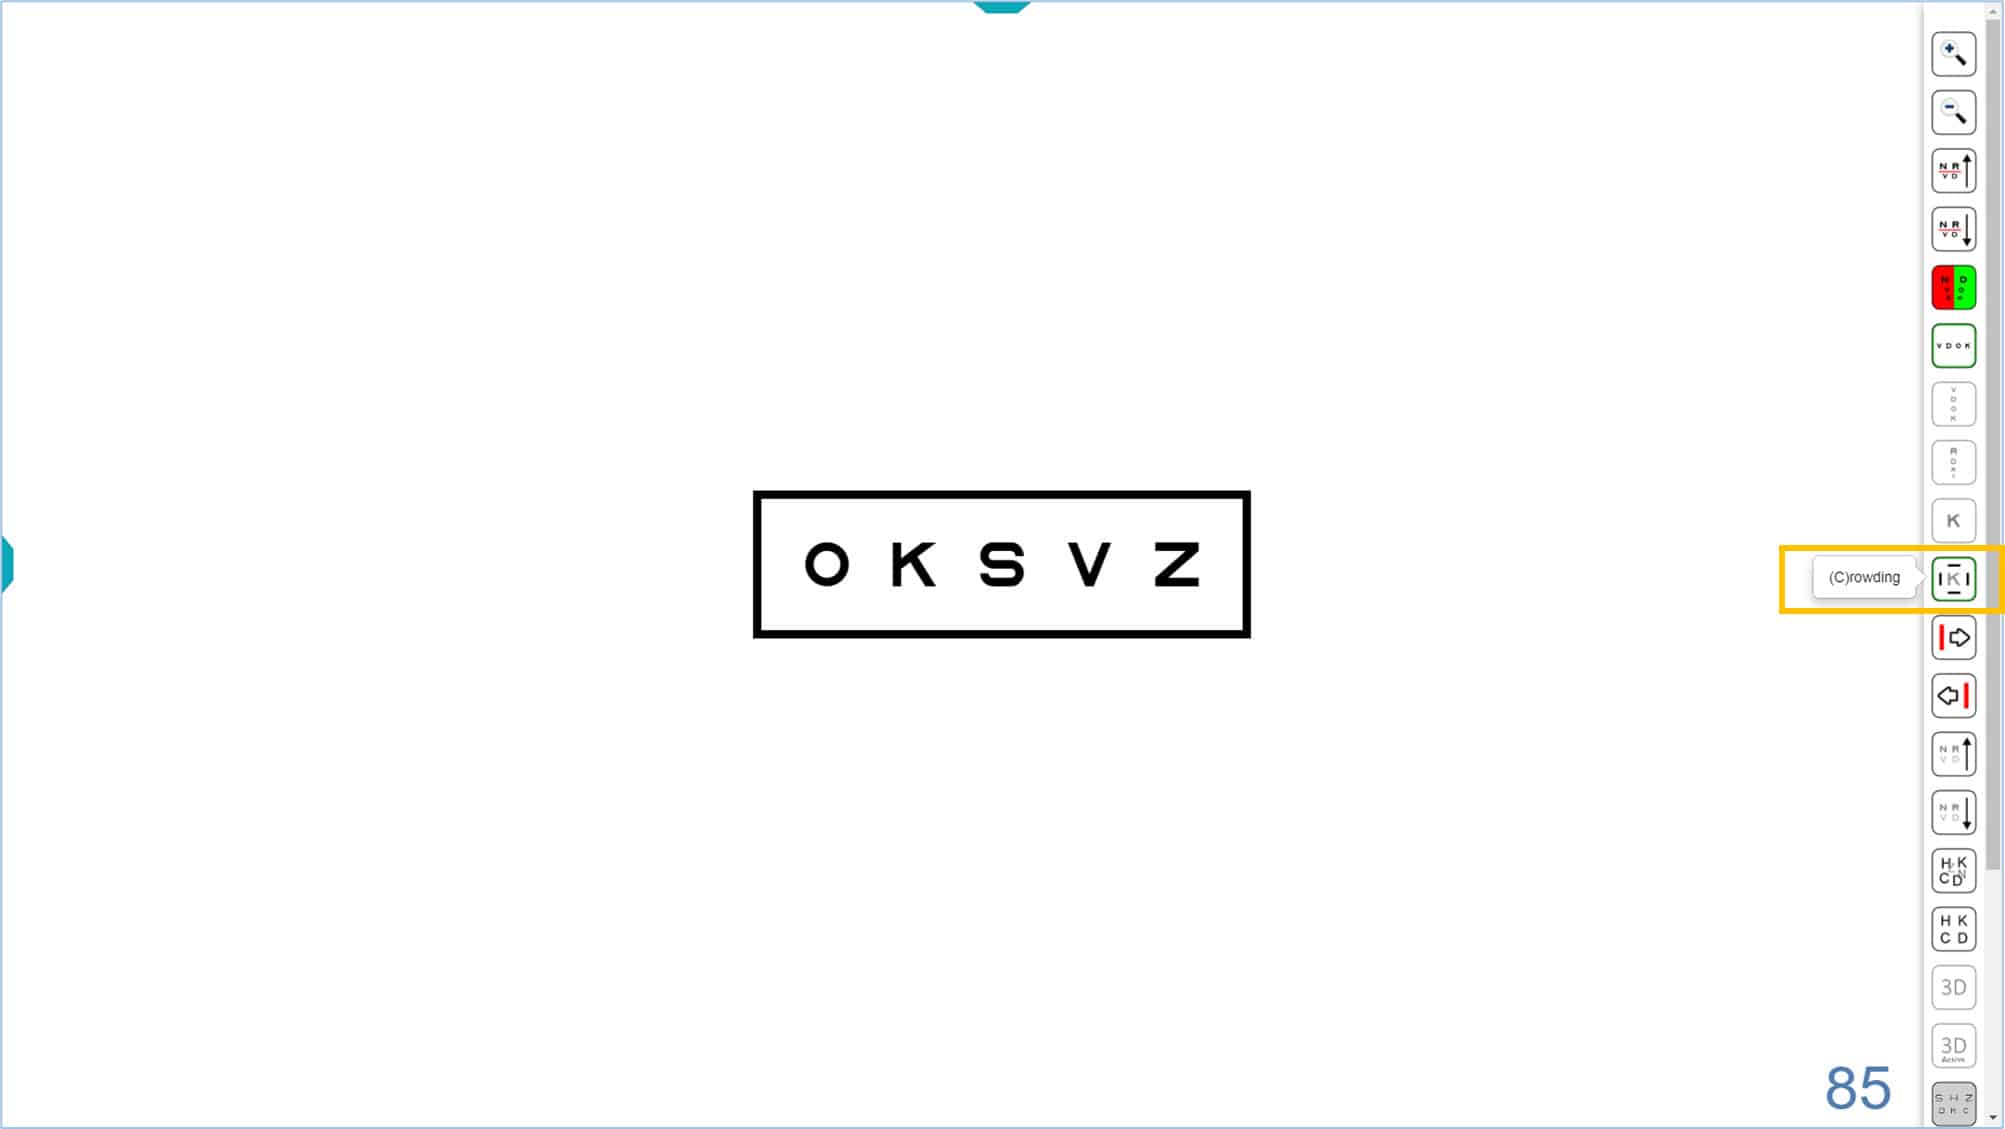
Using a single row of letters is advised with young or amblyopic children to prevent them from “getting lost” while reading the chart. To prevent falsely high acuity values, the line can be surrounded with a box that increases the contour interaction without distracting the child by showing additional letters. To display the box, click the “crowding” icon (see next figure) or type “C”. The rectangle has a stroke width equal to that of the letters or symbols shown, and is separated from the letters by a distance which is equal to the height of the letters or symbols. The separation can be adjusted to one half the letter height, which increases the contour interaction, by using the “setup” options.
![]()
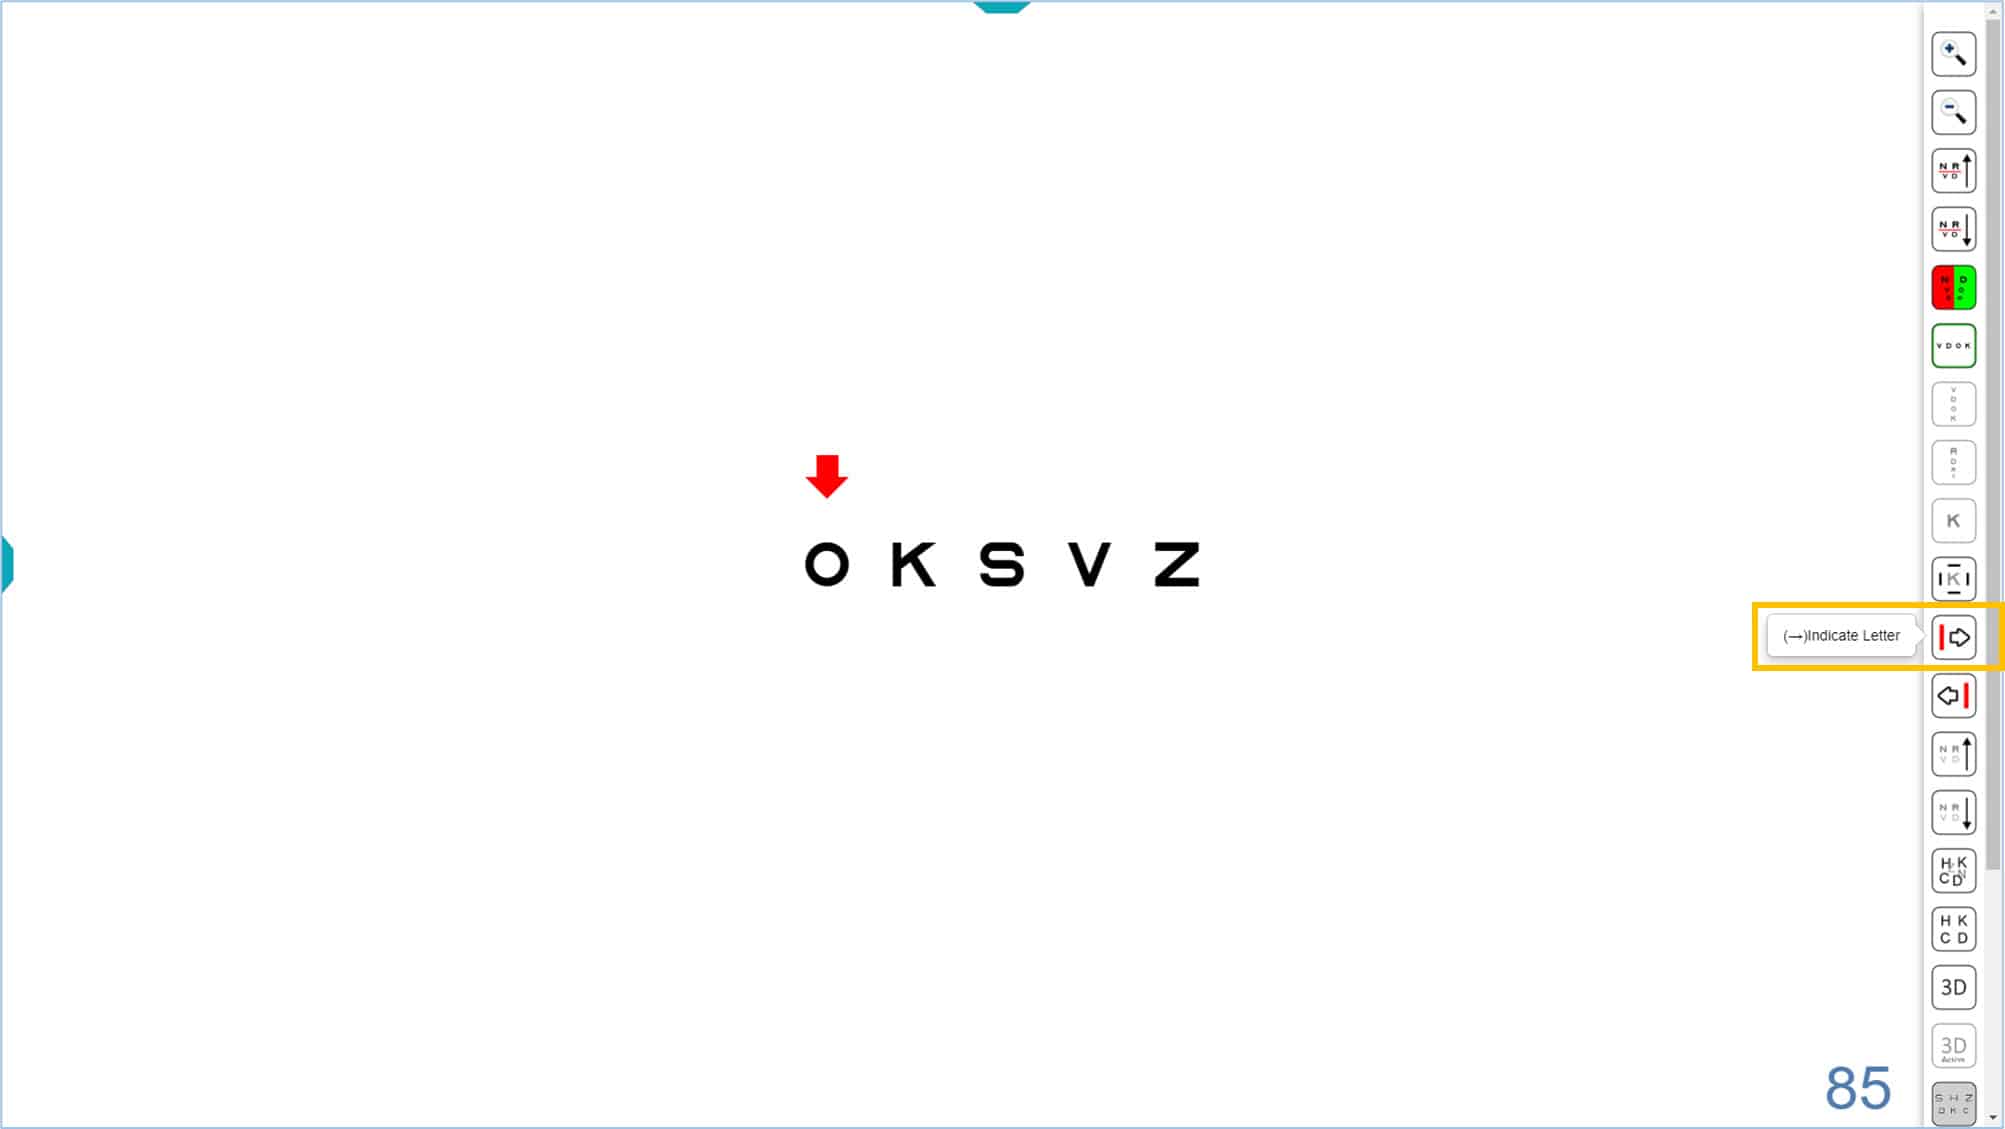
To indicate letters #
Sometimes it is necessary to indicate single letters, especially for young or amblyopic children because they skip or miss letters in the chart or line display. The program allows you to display a red arrow to indicate any of the 5 letters in a row. Click on the right → or left ← arrow (or on their icons) to display the red arrow. By pressing repeatedly on these keys, the arrow can be moved from side to side. Pressing again at the end of a line will make the arrow disappear.
![]()
![]()
The red arrow can be used with an isolated row of letters and during the automatic calculation of VA (See VA Testing Protocol):
The red arrow can also be useful for measuring VA in children with symmetric letter optotypes in isolated rows with contour interaction bars, which is the chart used for the VA Percentiles Curves. (3) The process to change the size of the letters (use ↑ or ↓ arrows) or the position of the red arrow (use → or ← arrows) is very simple. The arrow keys are very easy to handle on the mini wireless keyboards, since they are very accessible.
We strongly urge that parents use this fun and simple website animation https://optonet.online/practice-visual-acuity/ prior to the exam so that their young child has plenty of time to practice identifying the letters before the office visit. In this way, the child will be able to succeed early in the process and be more relaxed and confident for the rest of the exam.
Columns #
The program also allows isolating a column of same-sized letters by clicking on the tools menu icon or typing the letter “S”. The default letter size is 85 VAR (0.5 Dec, 20/40, 6/12). (The acuity value appears in the lower right corner of the screen).
![]()
Once the column is isolated, we can change its size by clicking on the tools menu icons, or using the keyboard shortcuts (“+” or “-” keys, or up ↑ or down ↓ arrows). The acuity value will be updated in the lower right corner.
This column of letters could be used, for example, for the measurement of horizontal vergence at distance, or to measure horizontal phoria using von Graefe’s technique. (See binocular vision section for additional tests of vergence). It may also be useful to assess horizontal diplopia in strabismic adults, as well as the compensatory effect of a prism for such patients.
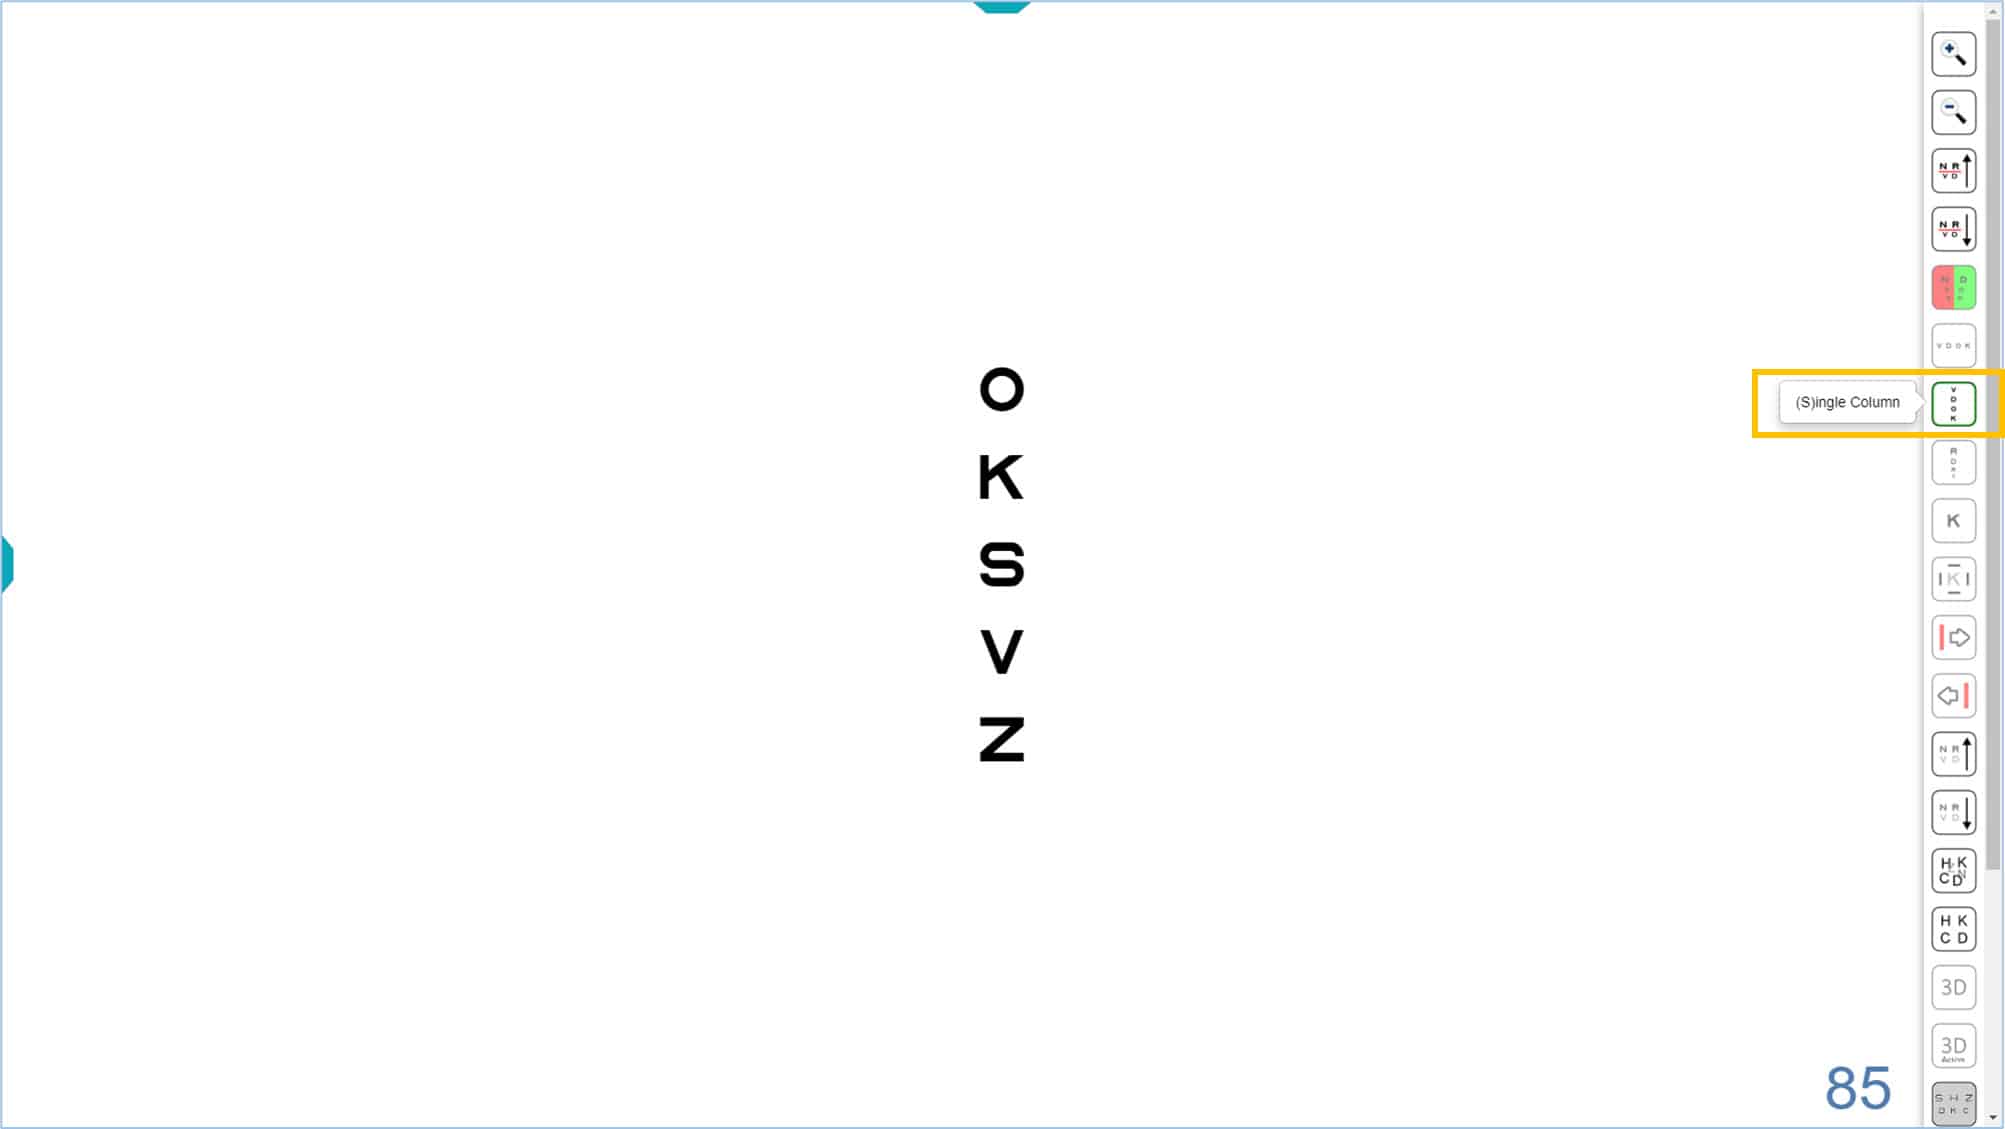
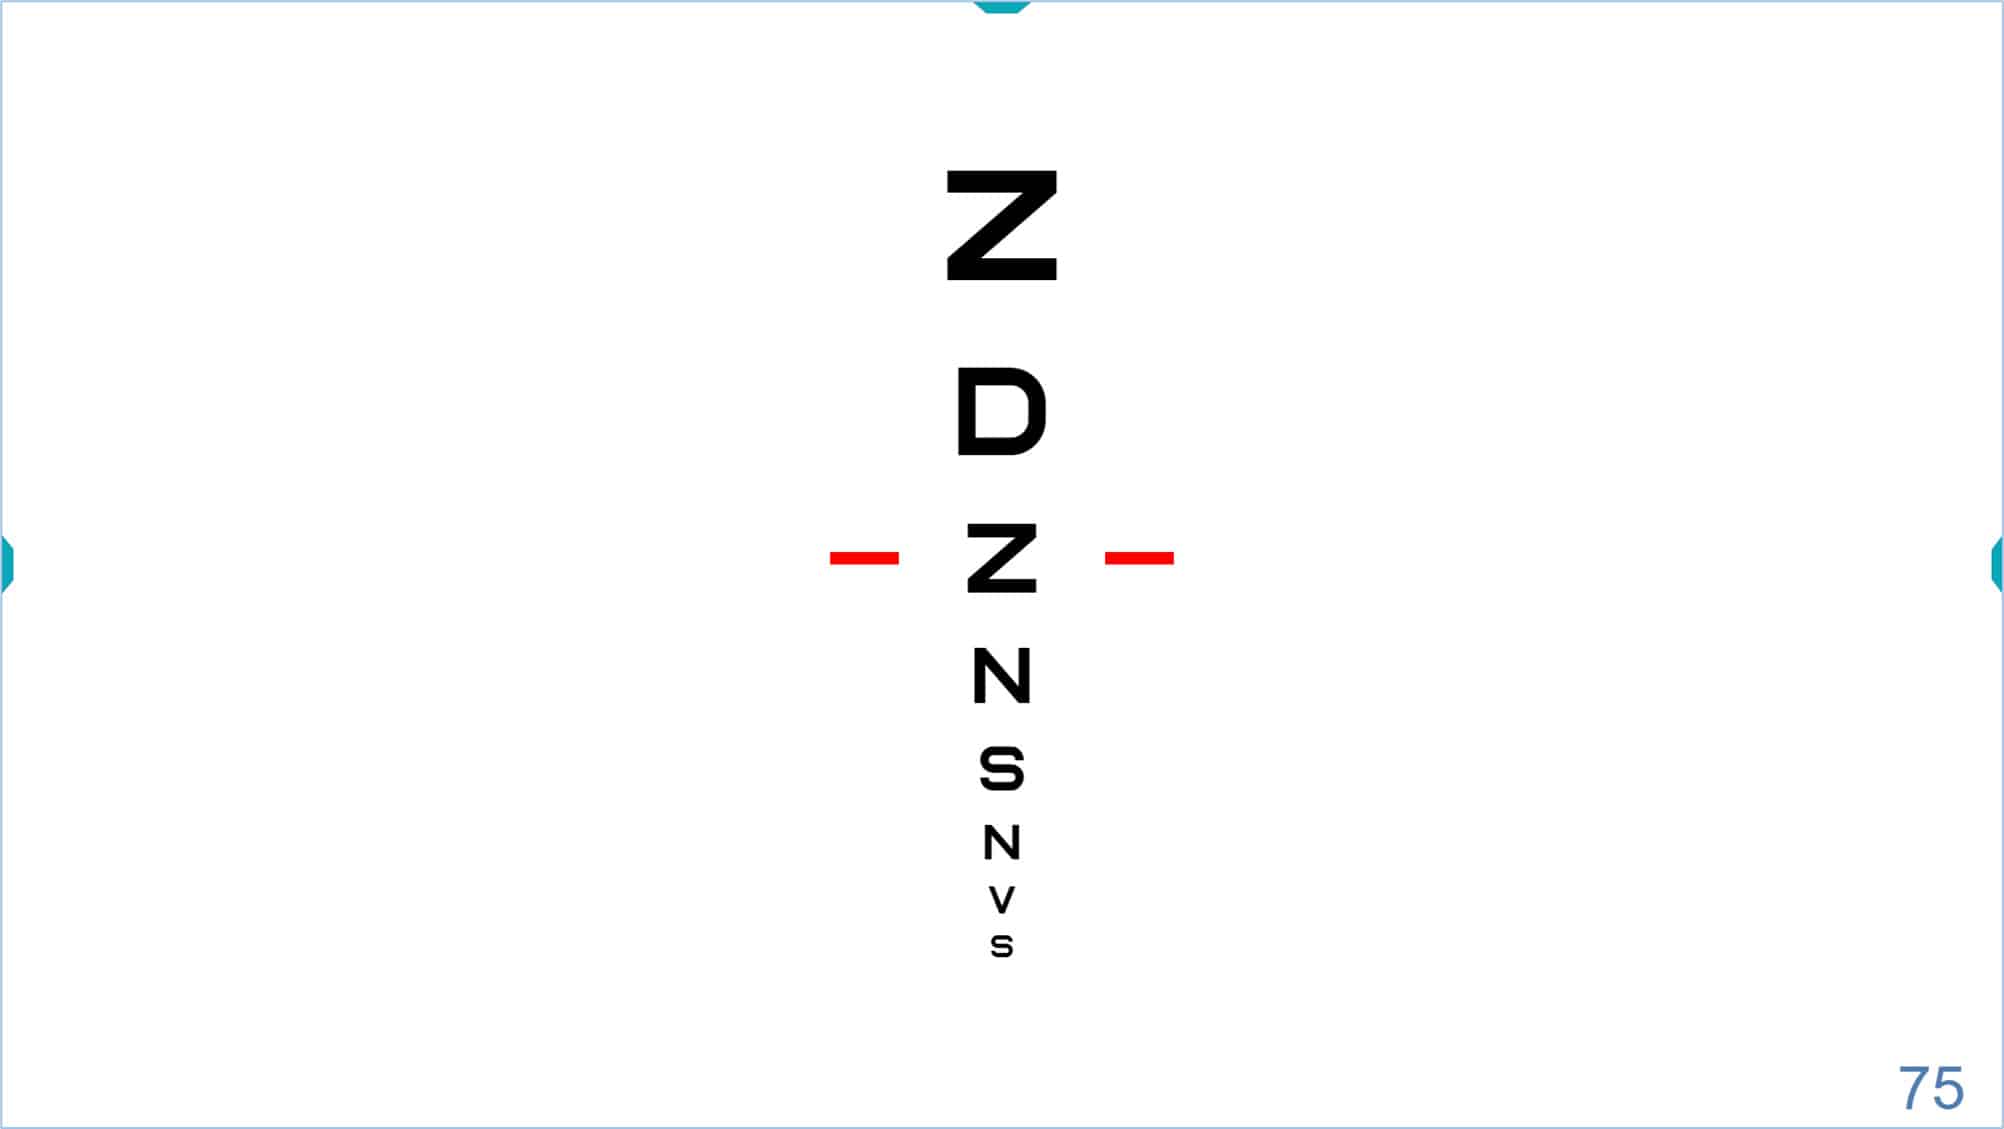
Finally, it is also possible to isolate the central column of the VA chart, to display the optotypes in descending size. To access this new column, click on the corresponding icon, or type “T” (or ← arrow) on the keyboard.
![]()
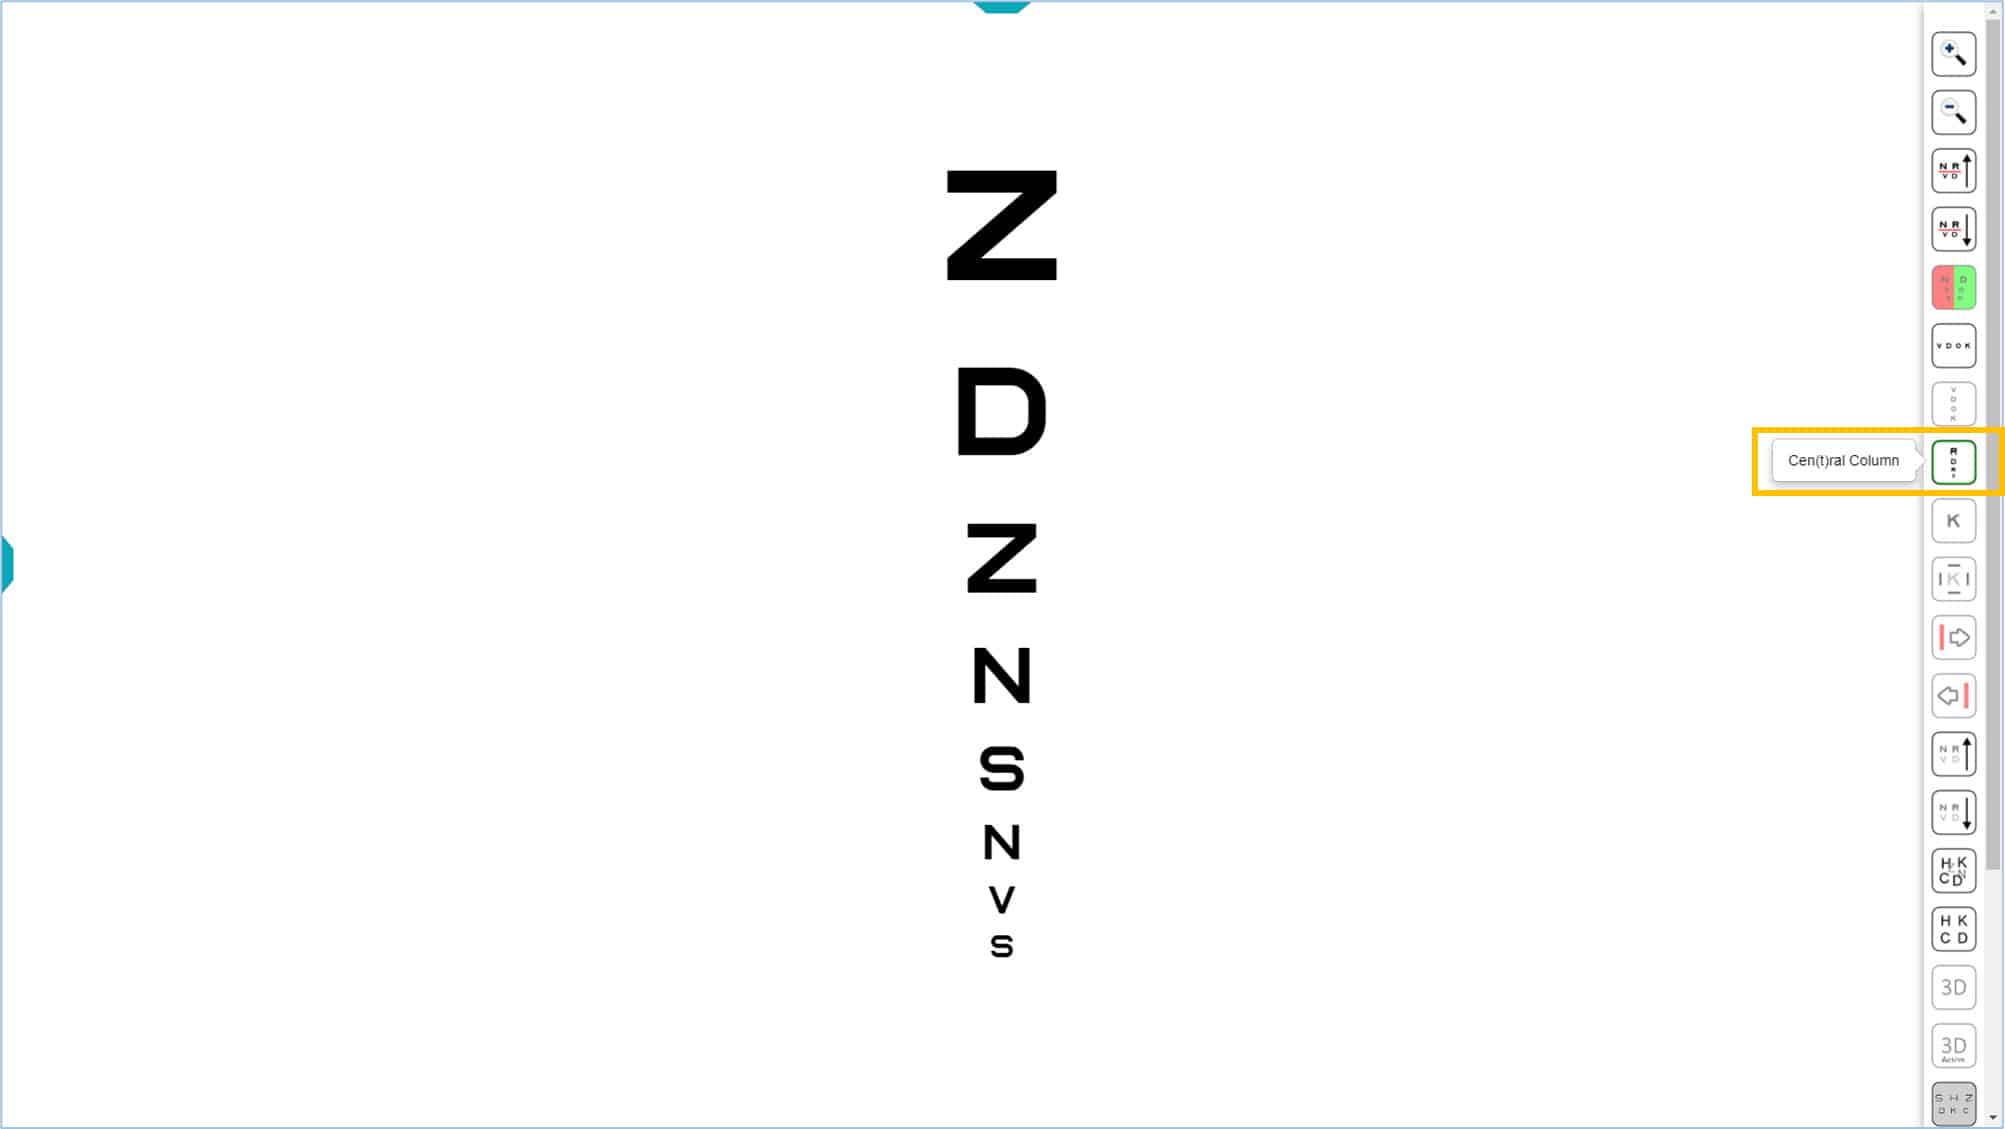
The central column could be used to quickly estimate VA, then start testing near threshold. (See VA Testing Protocol). This is especially useful for patients who tire quickly.
Isolated letters or symbols #
Finally, it is also possible to isolate a single letter or symbol by clicking on its icon, or the letter “L” (or → arrow) on the keyboard. Isolated optotypes are often useful to quickly estimate acuity in preschool children, or may be used as a stimulus for the Cover Test, that guarantees a precise and sustained fixation.
![]()
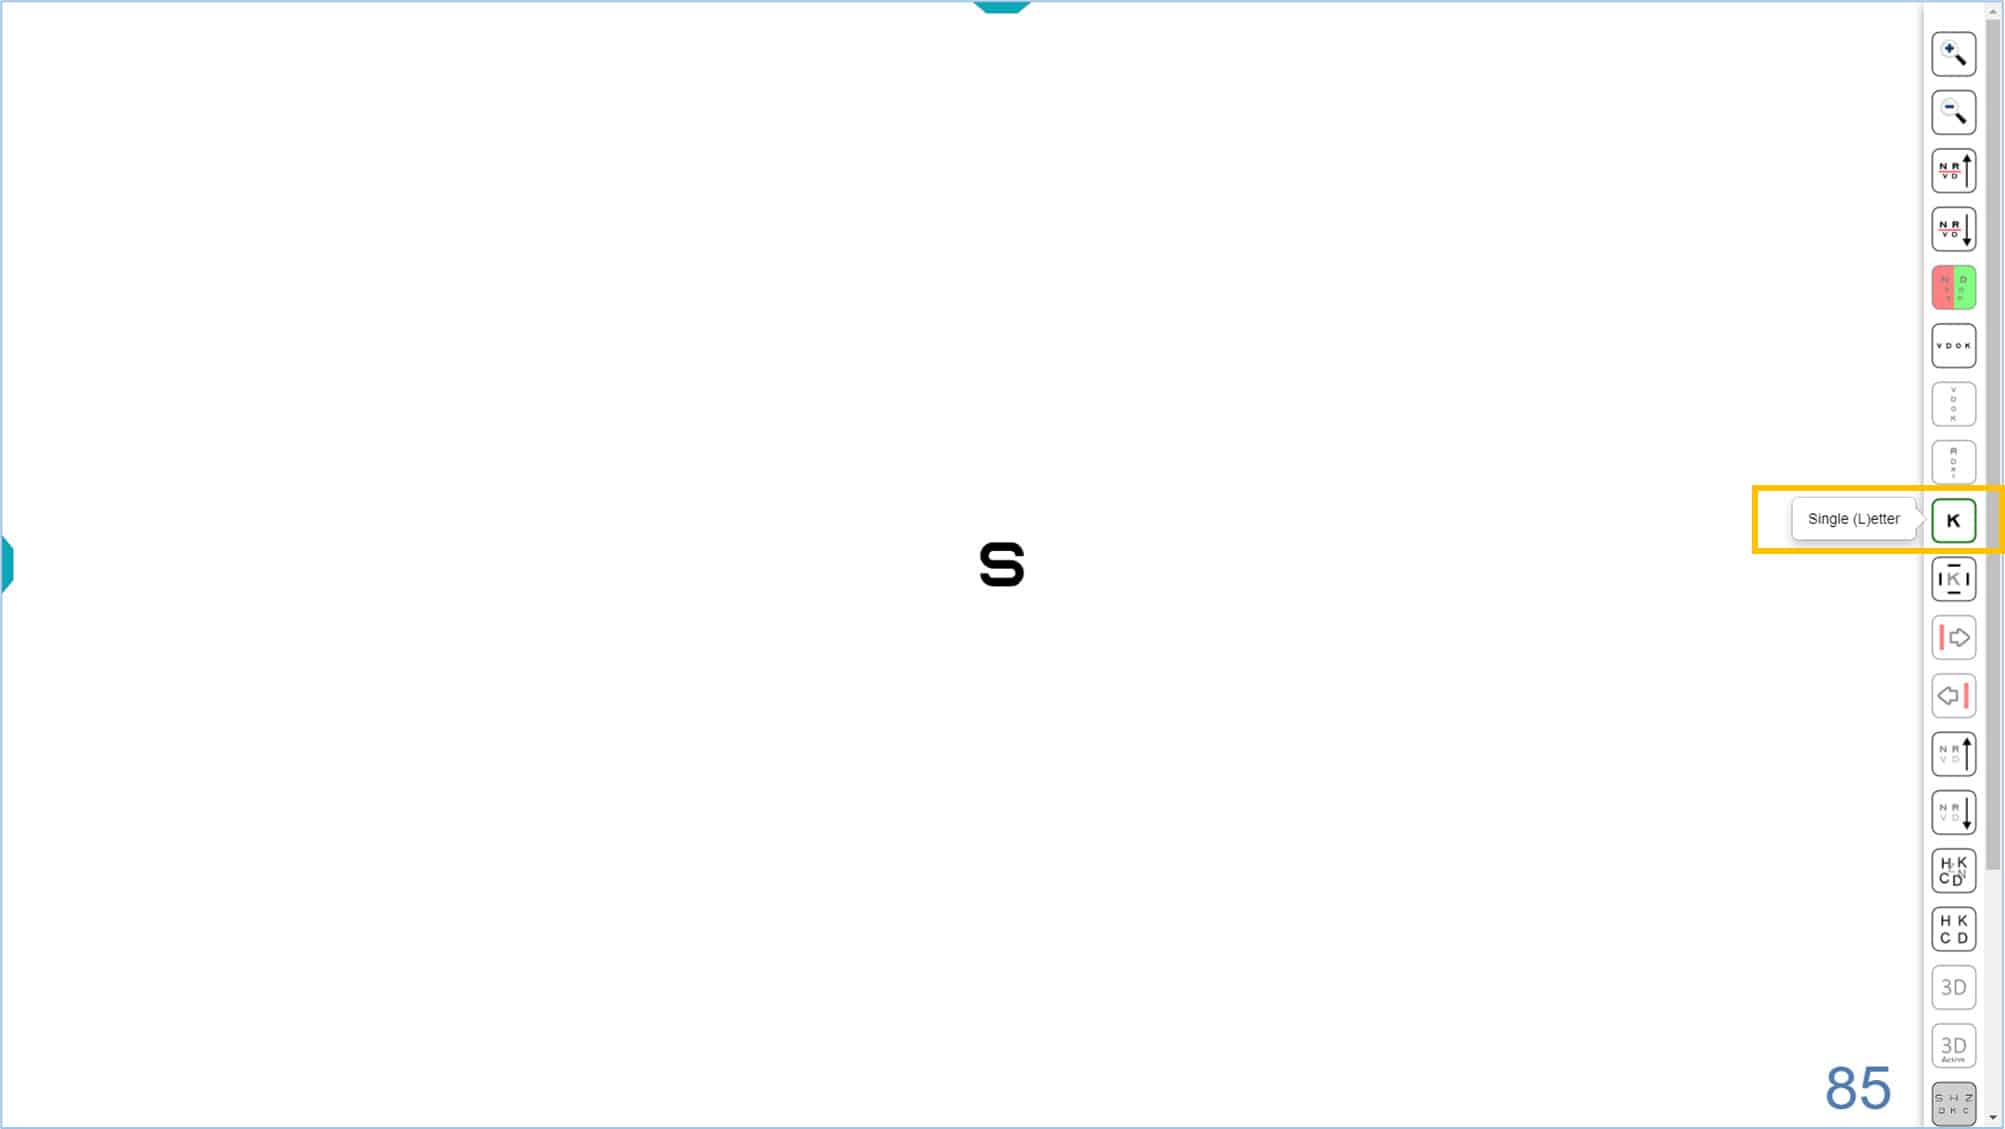
The default optotype size is 85 VAR (0.5 Dec, 20/40, 6/12) and its value is displayed in the lower right corner of the screen. Again, the size of the isolated optotype can be modified by pressing with the corresponding icons, or using either of two keyboard shortcuts “+” or “-”, or the up ↑ or down ↓ arrows. To return to the initial screen, with several rows of letters, click the isolated letter icon again, or re-type the letter “L” (or → arrow) on the keyboard.
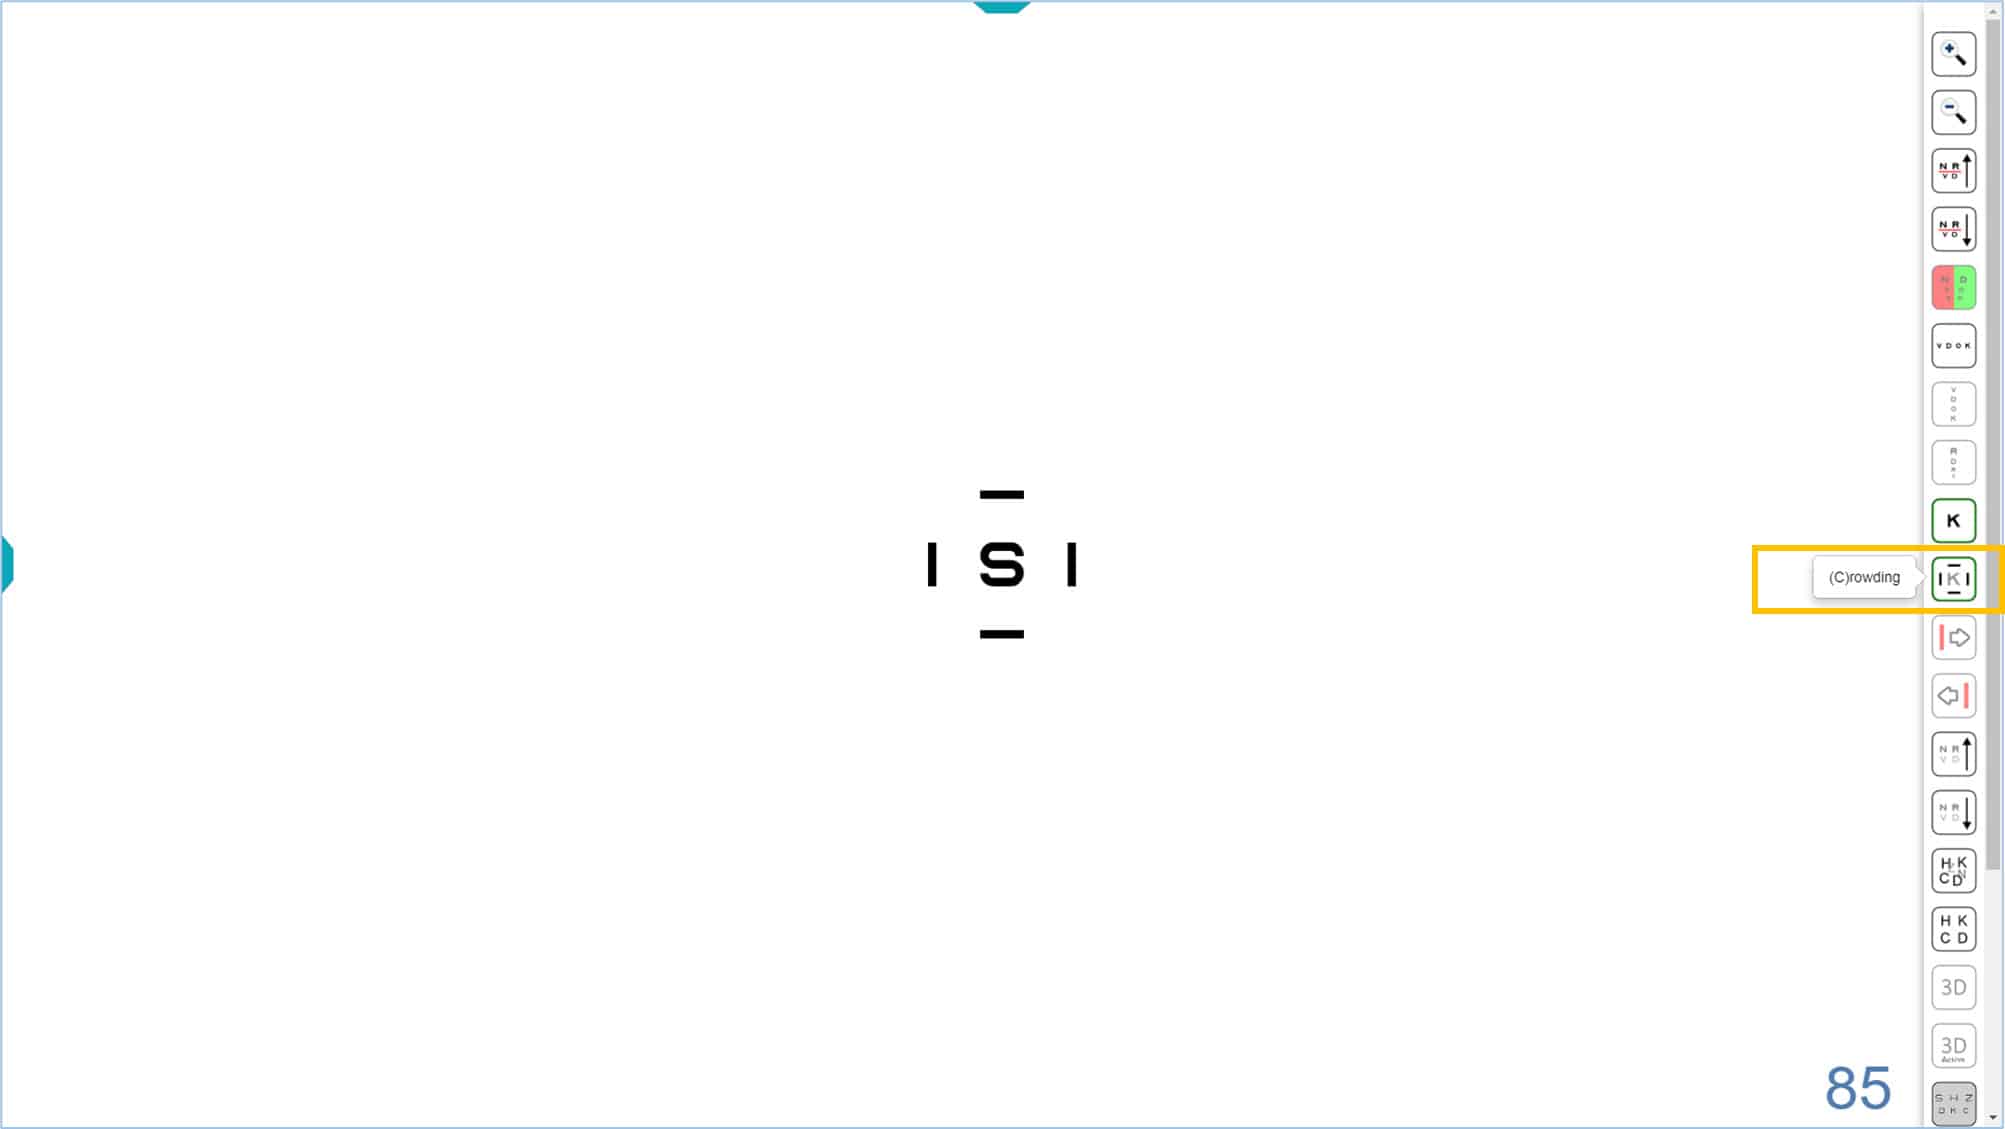
Single letters or symbols with surround bars for contour interaction #
As with the isolated row, it is possible to introduce contour interaction to the isolated optotype by pressing the corresponding icon, or the letter “C” on the keyboard (Crowding). Four surround bars appear, each with a thickness equal to that of the optotype line and separated by a distance equal to the size of the optotype.
If a stronger contour interaction effect is desired, the separation can be decreased to one half letter width in the configuration setup. The contours are removed by pressing the same icon or the letter “C” again. This display is similar to the targets used for younger amblyopic children by the Paediatric Eye Disease Investigator Group (PEDIG).
![]()
Contrast #
All VA optotypes are initially displayed at maximum contrast (100%). However, you can modify the contrast of the optotypes using either of two icons of the tools menu or using a keyboard shortcut (combine “Control” with right → or left ← arrows). Either method allows you to increase or decrease the contrast of the optotypes. The values of Contrast Sensitivity (CS) are displayed in the lower left corner of the screen. You can display the units of the measure by hovering the mouse over the number. The default is a log unit, but you can change to a percentage value by clicking the number, or by typing “Q”. Clicking or typing “Q” a second time returns to the default (log) unit.
The contrast varies from 100% (0.0 log) to 0.5% (2.30 log), in steps of 0.15 log.
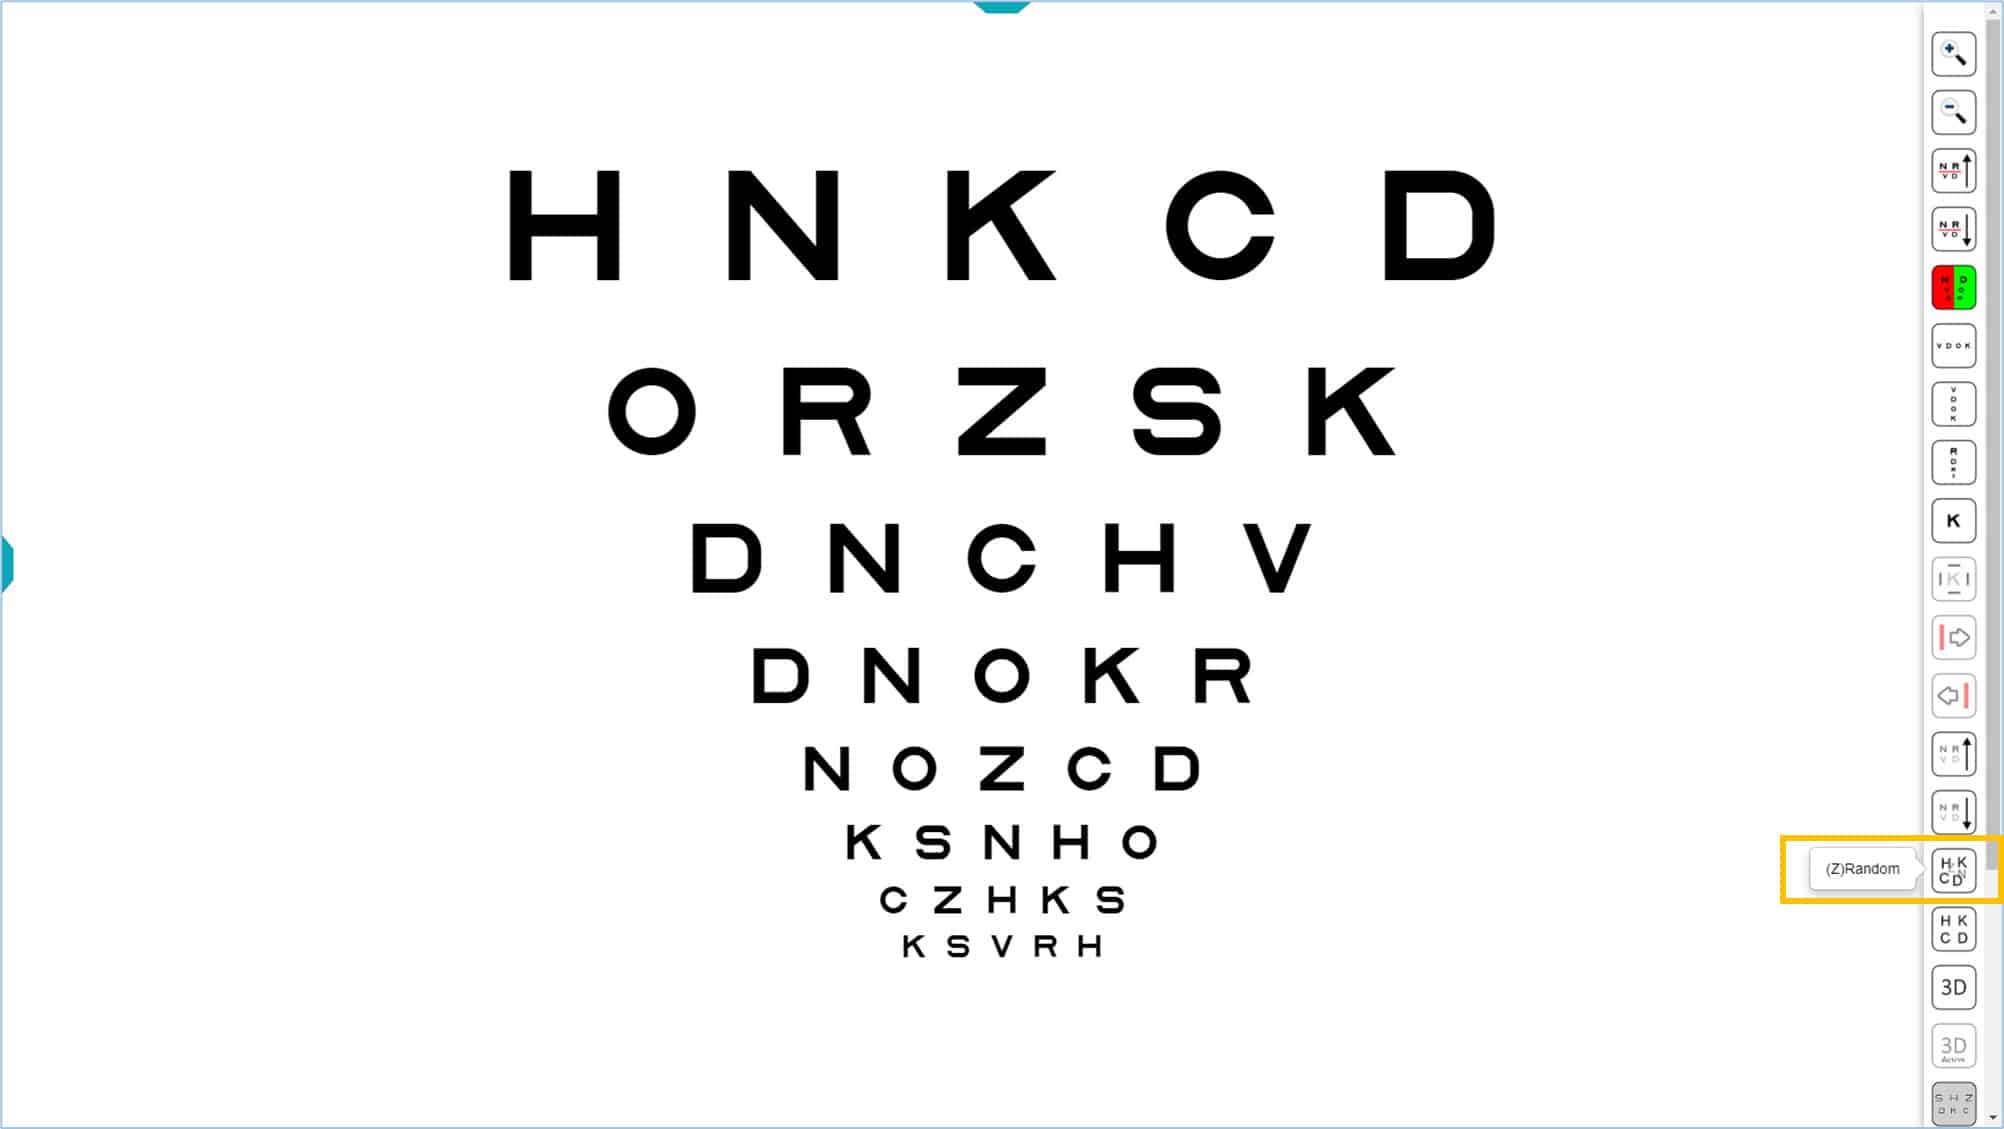
Randomizing the order of optotypes #
VA optotypes are always displayed with the same default letter/symbol distribution. However, to prevent the patient from memorizing them, the order can be randomized (and new letters introduced) by clicking the corresponding icon in the tools menu or by typing “Z” on the keyboard. To return to the initial letters, click the default icon, or re-type the letter “X”.
Vanishing Optotypes #
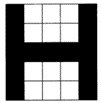
The vision unit incorporates a novel feature that allows converting conventional optotypes into vanishing optotypes by clicking on its tools menu icon or typing “V” on the keyboard.
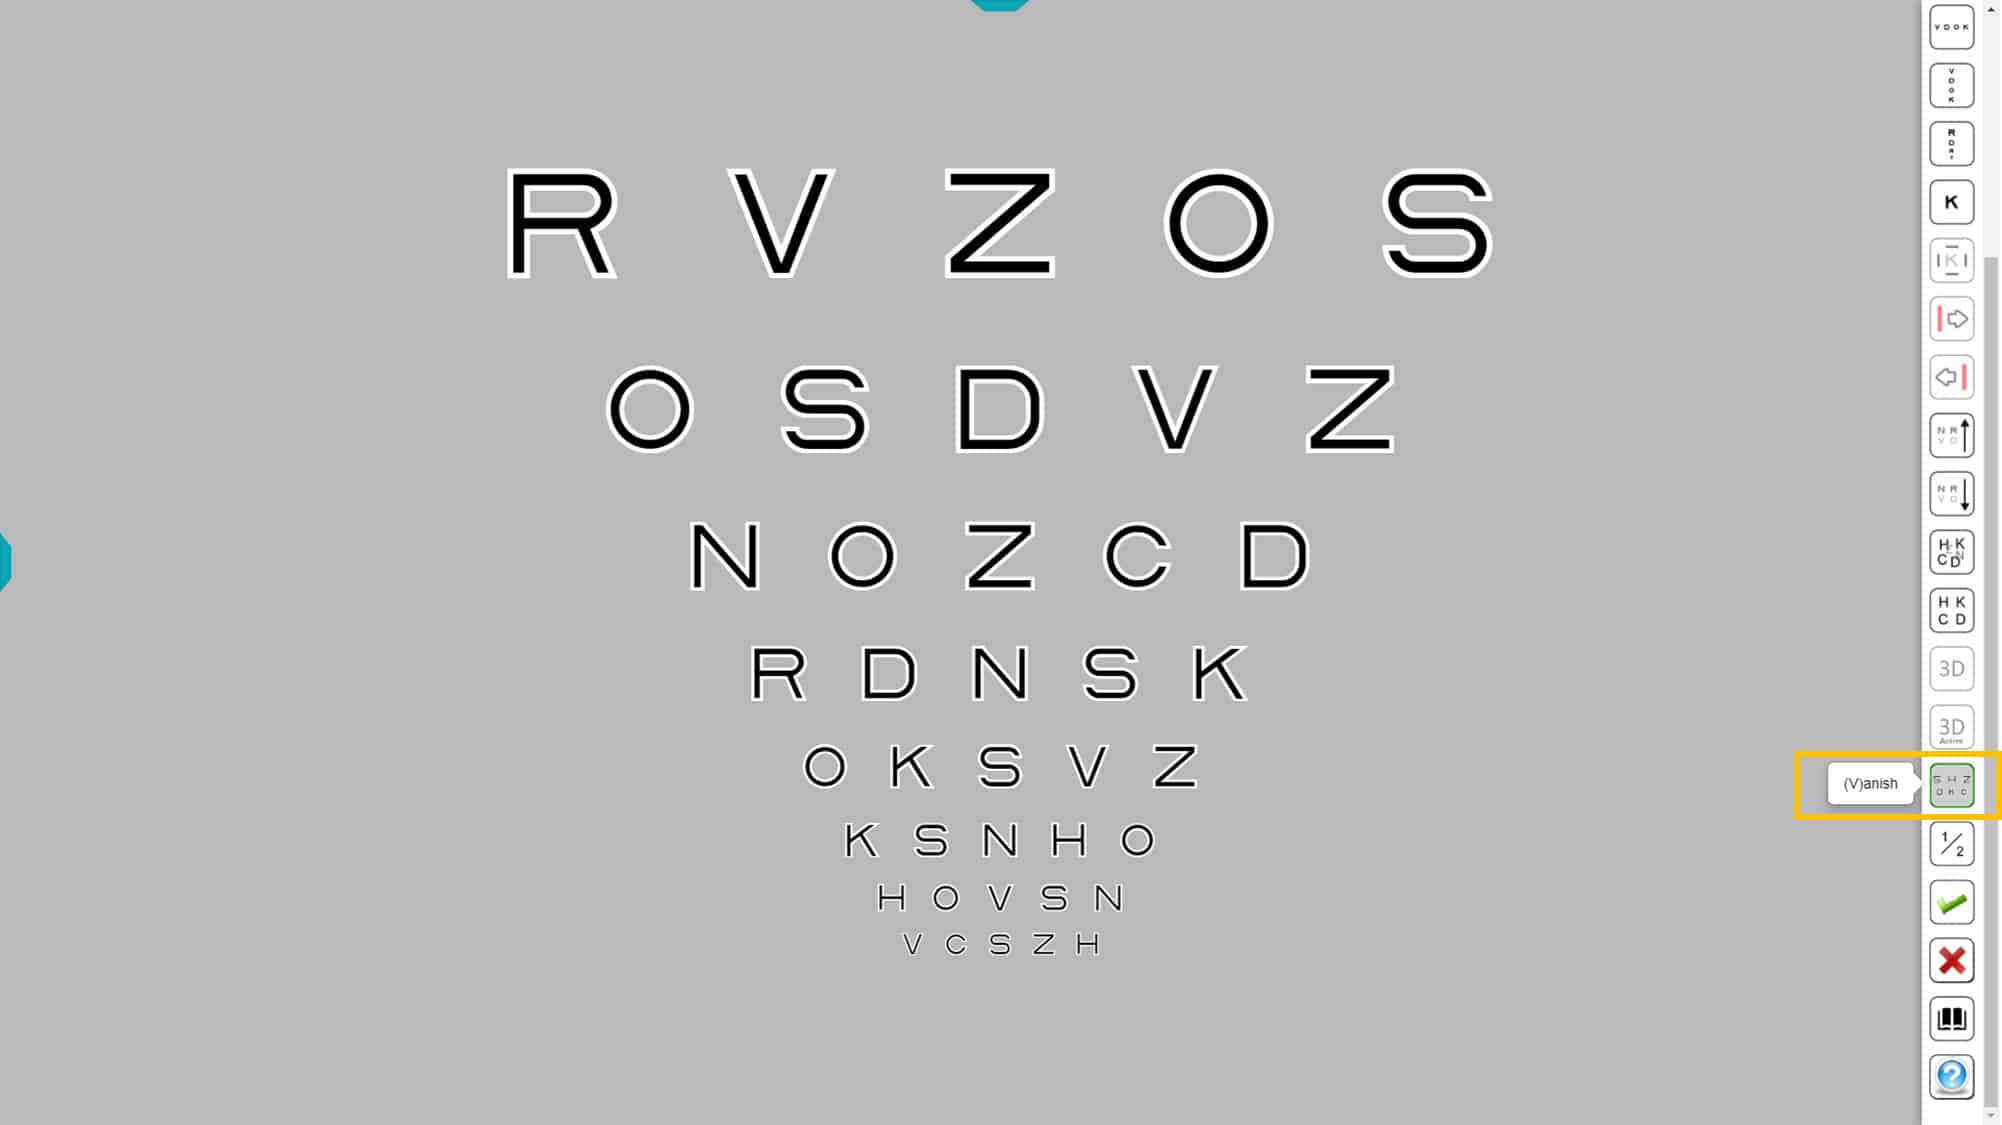
The Vanishing optotypes are formed by a central black trace (which gets smaller for smaller optotypes), surrounded by a white border on each side of half thickness. The letters thus created are displayed in front of a gray background, so that the average luminance of the letter is identical to the luminance of the background. In this way, when a letter is blurred, it disappears on the gray background; hence the name “vanishing” optotypes.
Using vanishing optotypes allows more sensitive detection of foveal vision loss than conventional optotypes. This is because conventional optotypes, made with black strokes on a white background, may still be distinguished, even when they are blurred or fuzzy.
Recent studies (4) have shown that measuring acuity with these new optotypes provides earlier detection of age-related macular degeneration (AMD). They are also significantly more sensitive in the follow-up of visual impairment in AMD.
Intermediate Steps #
The Optonet vision unit incorporates another novel feature, by adding an intermediate VA level between each row. This is a unique feature that currently is not available with any other acuity testing system. The intermediate levels allow a more accurate VA measurement.
This function can be very useful when a more precise measurement of the VA is required. For example, current (very expensive) treatments for age-related macular degeneration (AMD) are based upon acuity measures; however, in these patients the reliability of VA measurement is very low, with great variations from one day to the next. (5) In this situation it is important to have a tool to measure the VA with the maximum possible precision which can be achieved using the intermediate steps.
To activate the intermediate step feature, click the 1/2 step icon in the tools menu (available with any of the optotypes). The new scale can also be accessed by typing “P”.

The optotypes are still calibrated on a logarithmic scale, with a size change equivalent to 0.05 instead of 0.1 log units. Calculating acuity is simple using the VAR notation: each letter that sees the patient is assigned a value of 0.5 instead of 1.
Once the 1/2 step function is selected, this option is saved automatically, so that the next time the program is opened, the intermediate steps option is activated already. This is useful for professionals who prefer to always work with intermediate steps.
Tablet as a remote controller for VA #
A tablet (Android or iPad) can be paired with the distance vision chart in the testing room, to be used for the remote control of visual acuity charts.
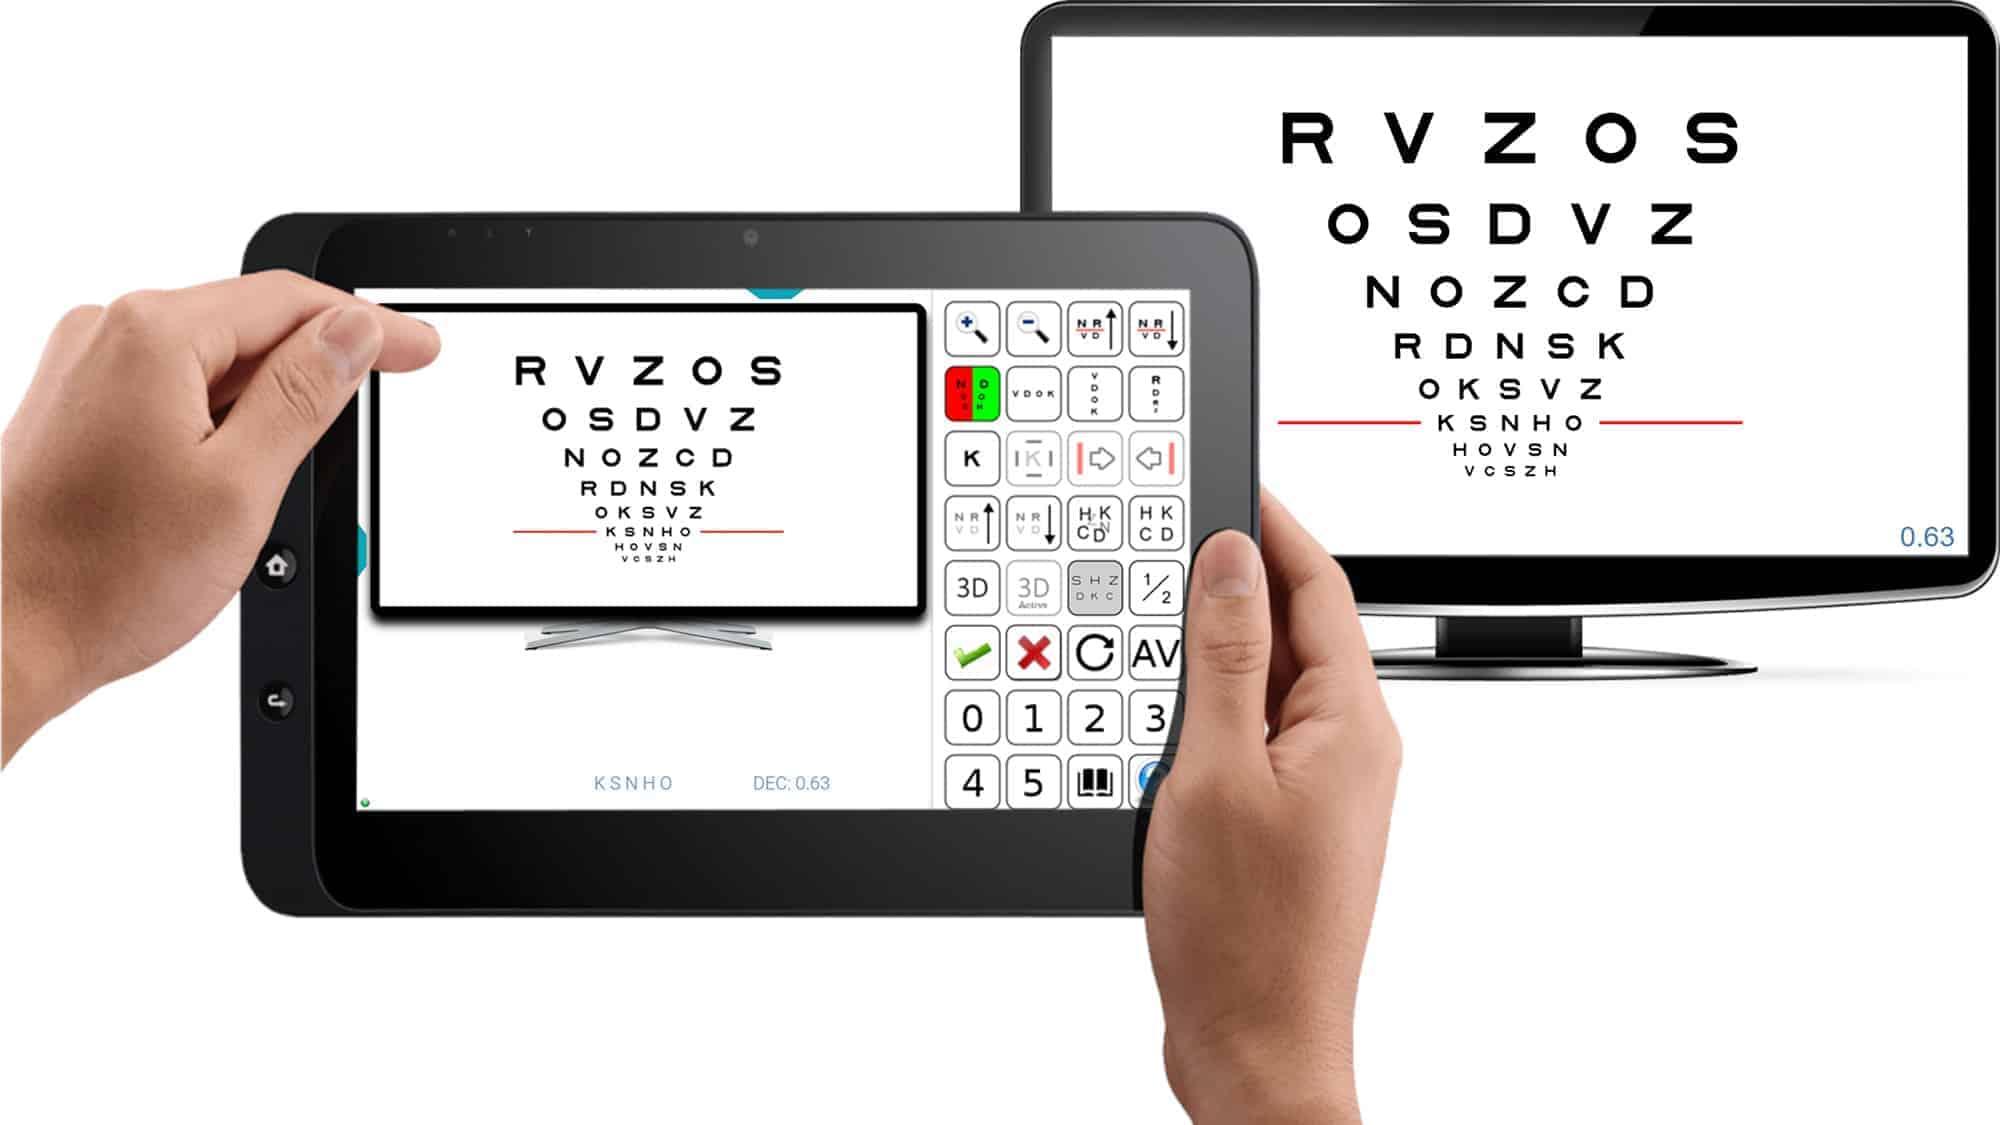
The tablet transforms into a remote control, displaying on the left what the patient sees at a distance, and on the right, all the icons of the tools menu for this chart.
This way, the professional can see on the tablet’s screen the same thing that the patient is viewing on the vision Unit, without having to turn around to look at the distant screen.
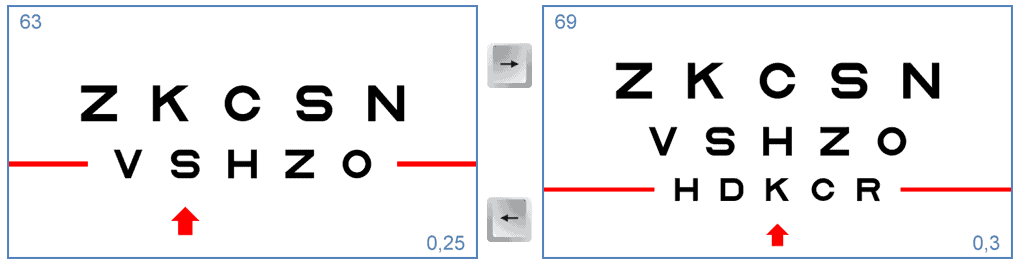
The tablet also displays the updated visual acuity value of the isolated or selected row of letters with red lines (0.63 Decimal VA in the above example). It also shows the letters that make up the selected row (K, S, N, H, and O in our example).
VA Optotypes #
The Optonet Vision Unit contains a battery of VA charts for both distance and near vision. Upon clicking on the “Refraction” group and then “Visual Acuity (VA)” in the main menu of the Vision Unit, 5 icons are displayed, providing access to charts of Letters, Numbers, as well as the classic Landolt “Cs” and Snellen “Es”.
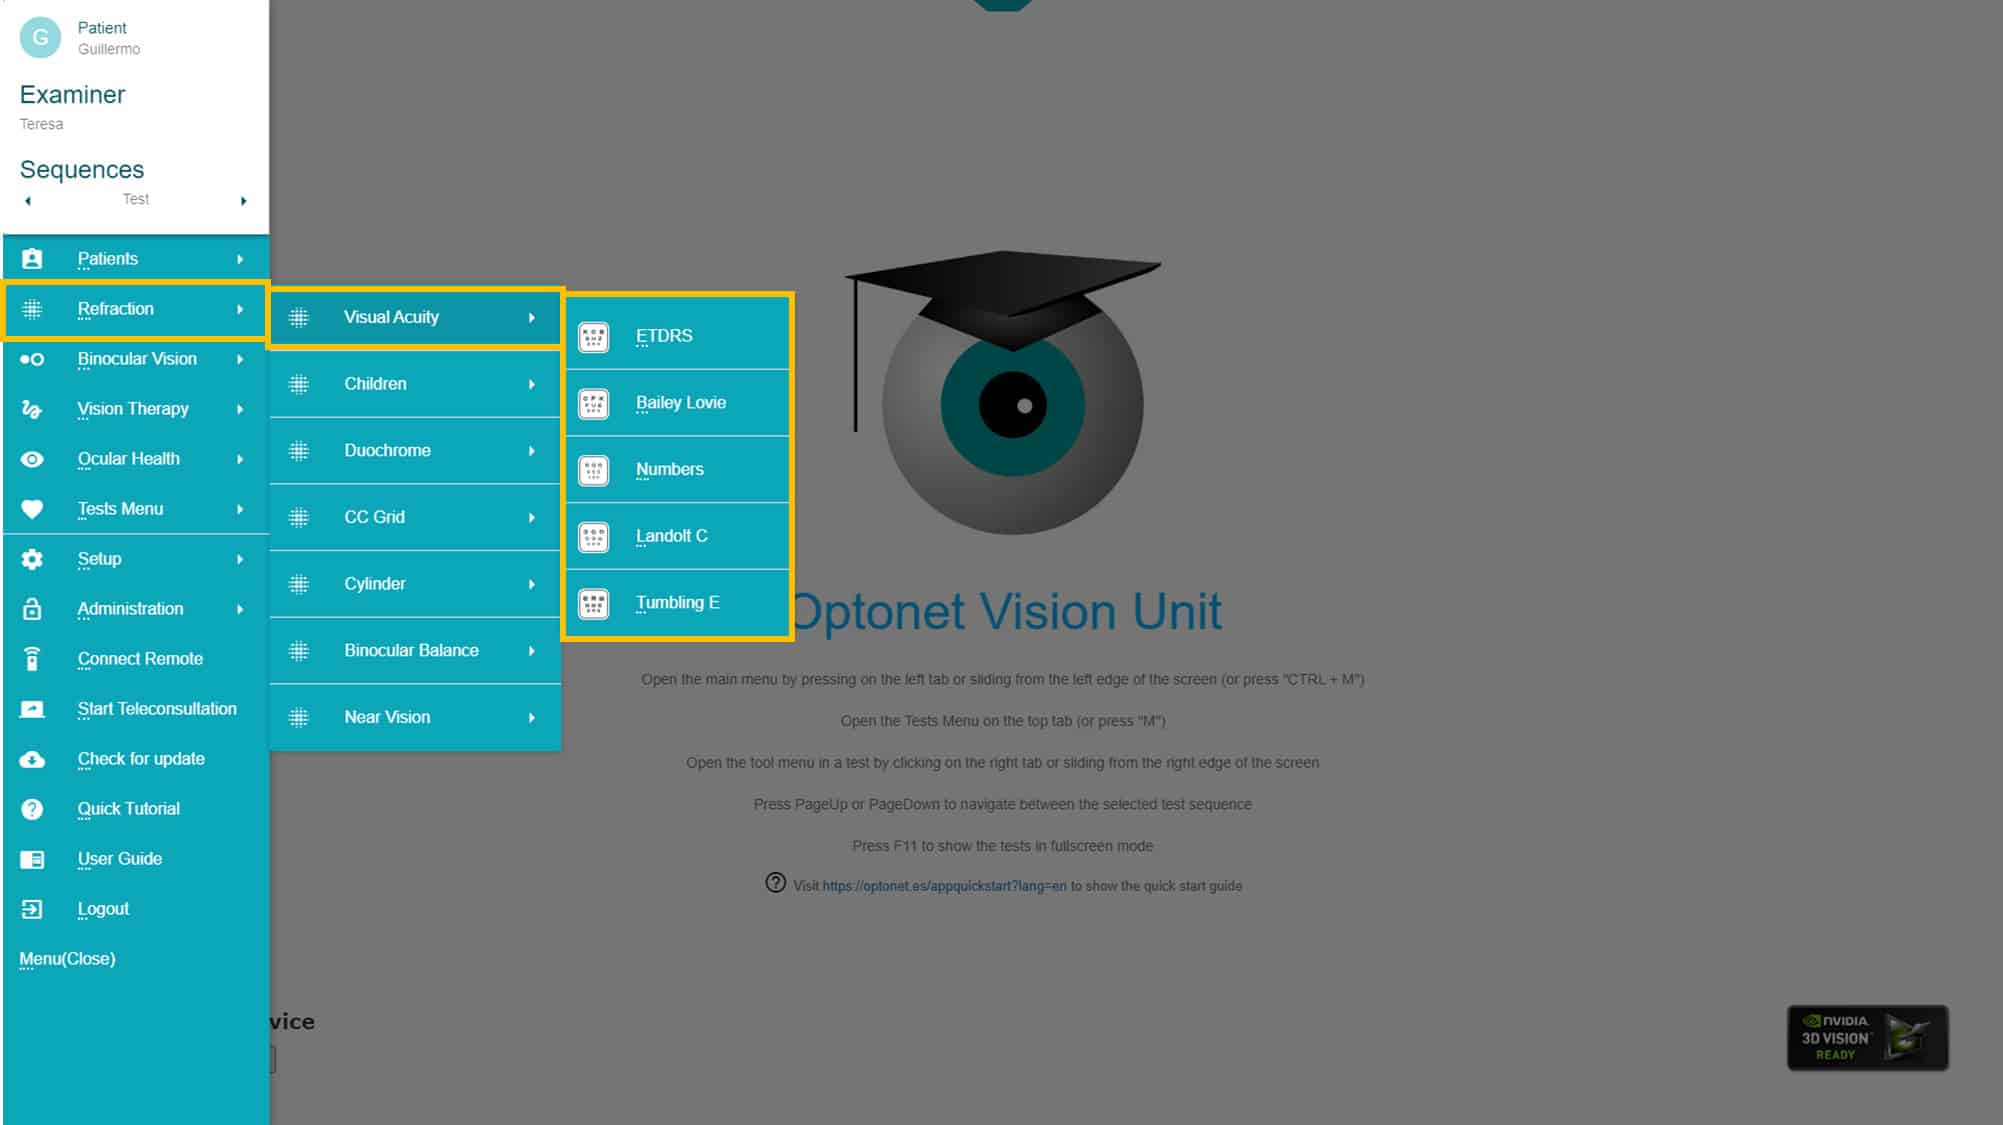
The recommended VA chart for patients over 6 years old is the one composed of “Sloan” letters (also known as ETDRS). In addition to Sloan letters, you can choose from a variety of logarithmic VA optotypes, including British letters, Numbers, Landolt “Cs”, and Snellen “Es”. These latter optotypes facilitate the measurement of VA and refraction in patients with limited cooperation. Let’s have a closer look at a more detailed description of these optotypes.
Sloan letters #
This is the recommended optotype for VA measurement and clinical refraction. It consists of 10 letters designed in 1959 by Louise Sloan: (C, D, H, K, N, O, R, S, V and Z).
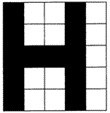
The Sloan letters have the same height to width ratio, similar to the structure of the Snellen letters, drawn on a 5×5 matrix.
The Sloan letters are used in the ETDRS charts, which also employ the logMAR design proposed by Bailey-Lovie. (1),(6) The ETDRS charts are so named because they were used in the “Early Treatment of Diabetic Retinopathy Study” (6) funded by the National Eye Institute in the United States. The ETDRS employed the logMAR design to measure VA in the most reliable, standardized and reproducible way. Today, the ETDRS chart is preferred to the traditional Snellen chart (in use since 1862) whenever precise measurement of visual acuity is necessary in research or clinical settings.
The Sloan letters are equally discriminable, similar to Landolt “Cs”. Each row of the ETDRS chart uses a combination of letters with a global difficulty similar to the other rows. In total, 28 combinations of letters of equal difficulty are used.(6) This distribution of letters was based on a study carried out by the designers of the optotypes using data from 234 eyes. This study gave rise to the original ETDRS optotypes that are currently used internationally.(6)
Subsequently, the authors themselves reviewed the difficulty of the Sloan letters and used the results from 7,420 eyes to adjust the combinations of Sloan letters in each row, resulting in “revised” ETDRS letters. (7) In theory, these new combinations are slightly more balanced in difficulty. The vision unit allows you to choose between “original” or “revised” Sloan letters (using the configuration menu).
This Sloan letters were selected by the International Council of Ophthalmology (8) as the reference optotype for VA measurement, and have since been used as a standard in research studies.
British Letters #
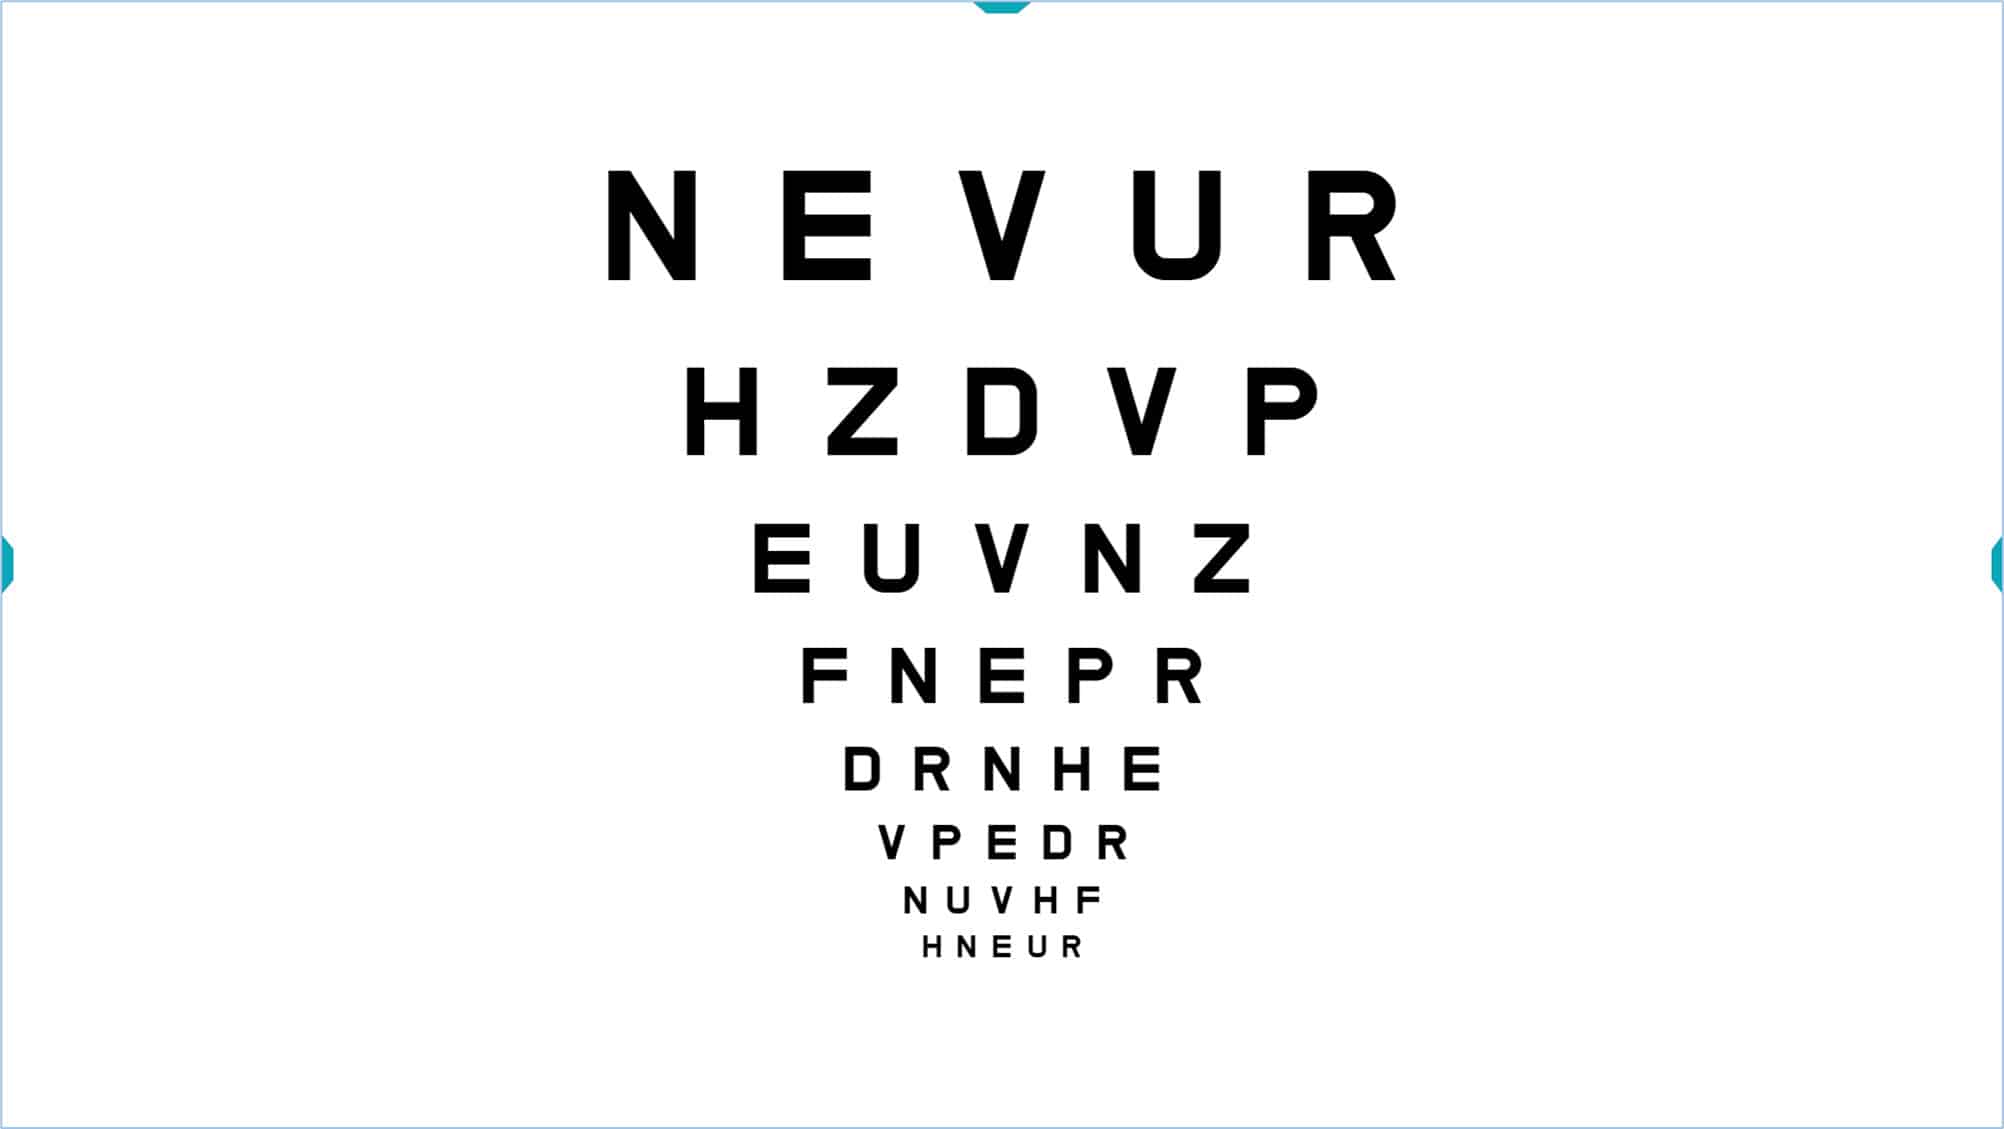
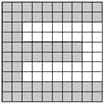
Two versions of British letter charts are included. The first is the classic (1968) standard set which uses the following 10 letters: D, H, N, U, V, F, R, P, E, Z, drawn on a 5×4 matrix, (ratio of height:width is 5:4). The second is a revised standard (2003) in which letters are drawn on a 5×5 matrix (equal height:width) similar to the Snellen “E”. The revised set uses the same letter set plus two additional letters: the “C” and “K” (12 letters in total). All these letters are also considered of similar difficulty (9) by British standards.
Numbers #
Two versions of the numbers chart are provided. The default version uses only the following four numbers: 8, 9, 6, 5, which are equally discriminable. The numbers are Arial type, drawn on a 5×4 matrix. The program has an option to use an expanded set of numbers (2, 3, 5, 6 and 9), drawn on a 5×5 matrix, similar to the Snellen “E”.
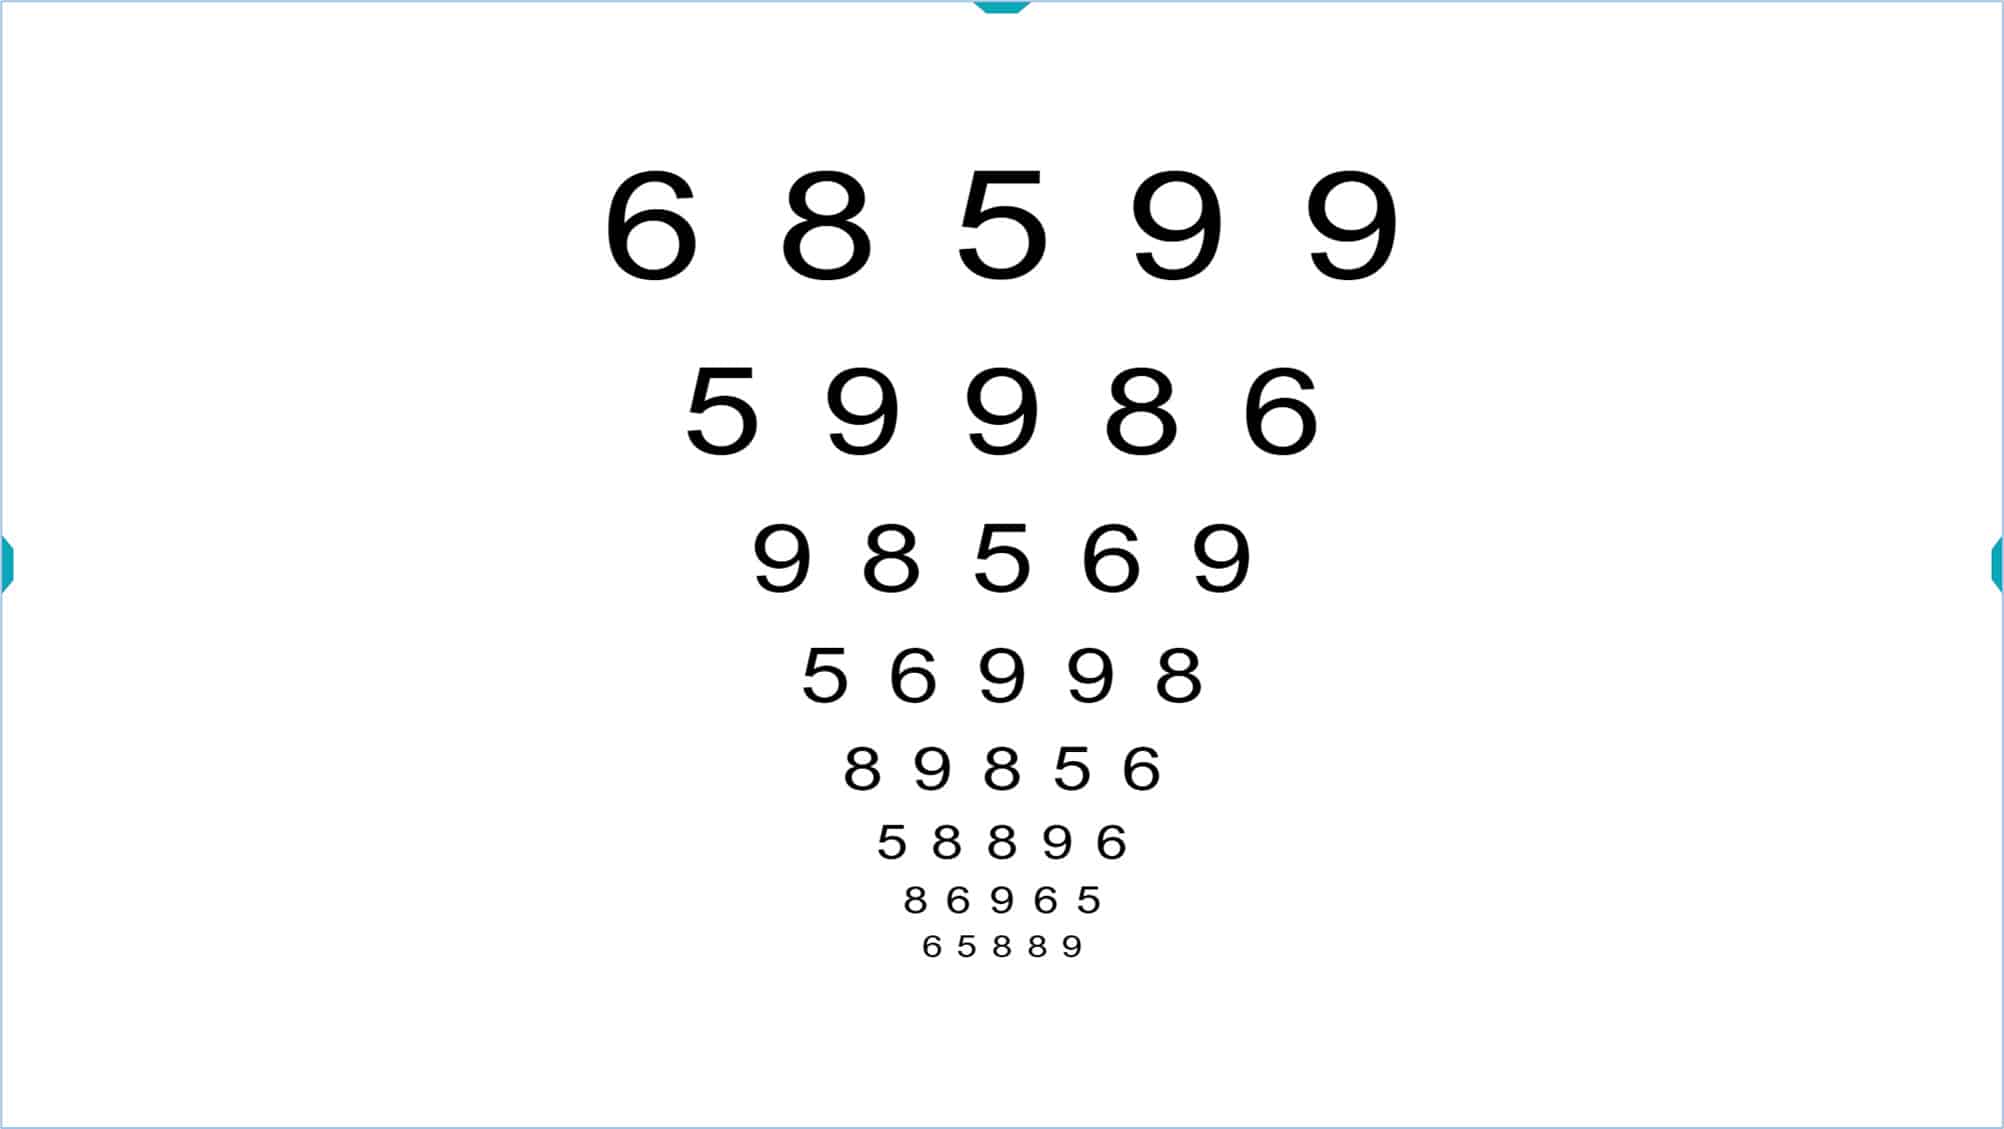
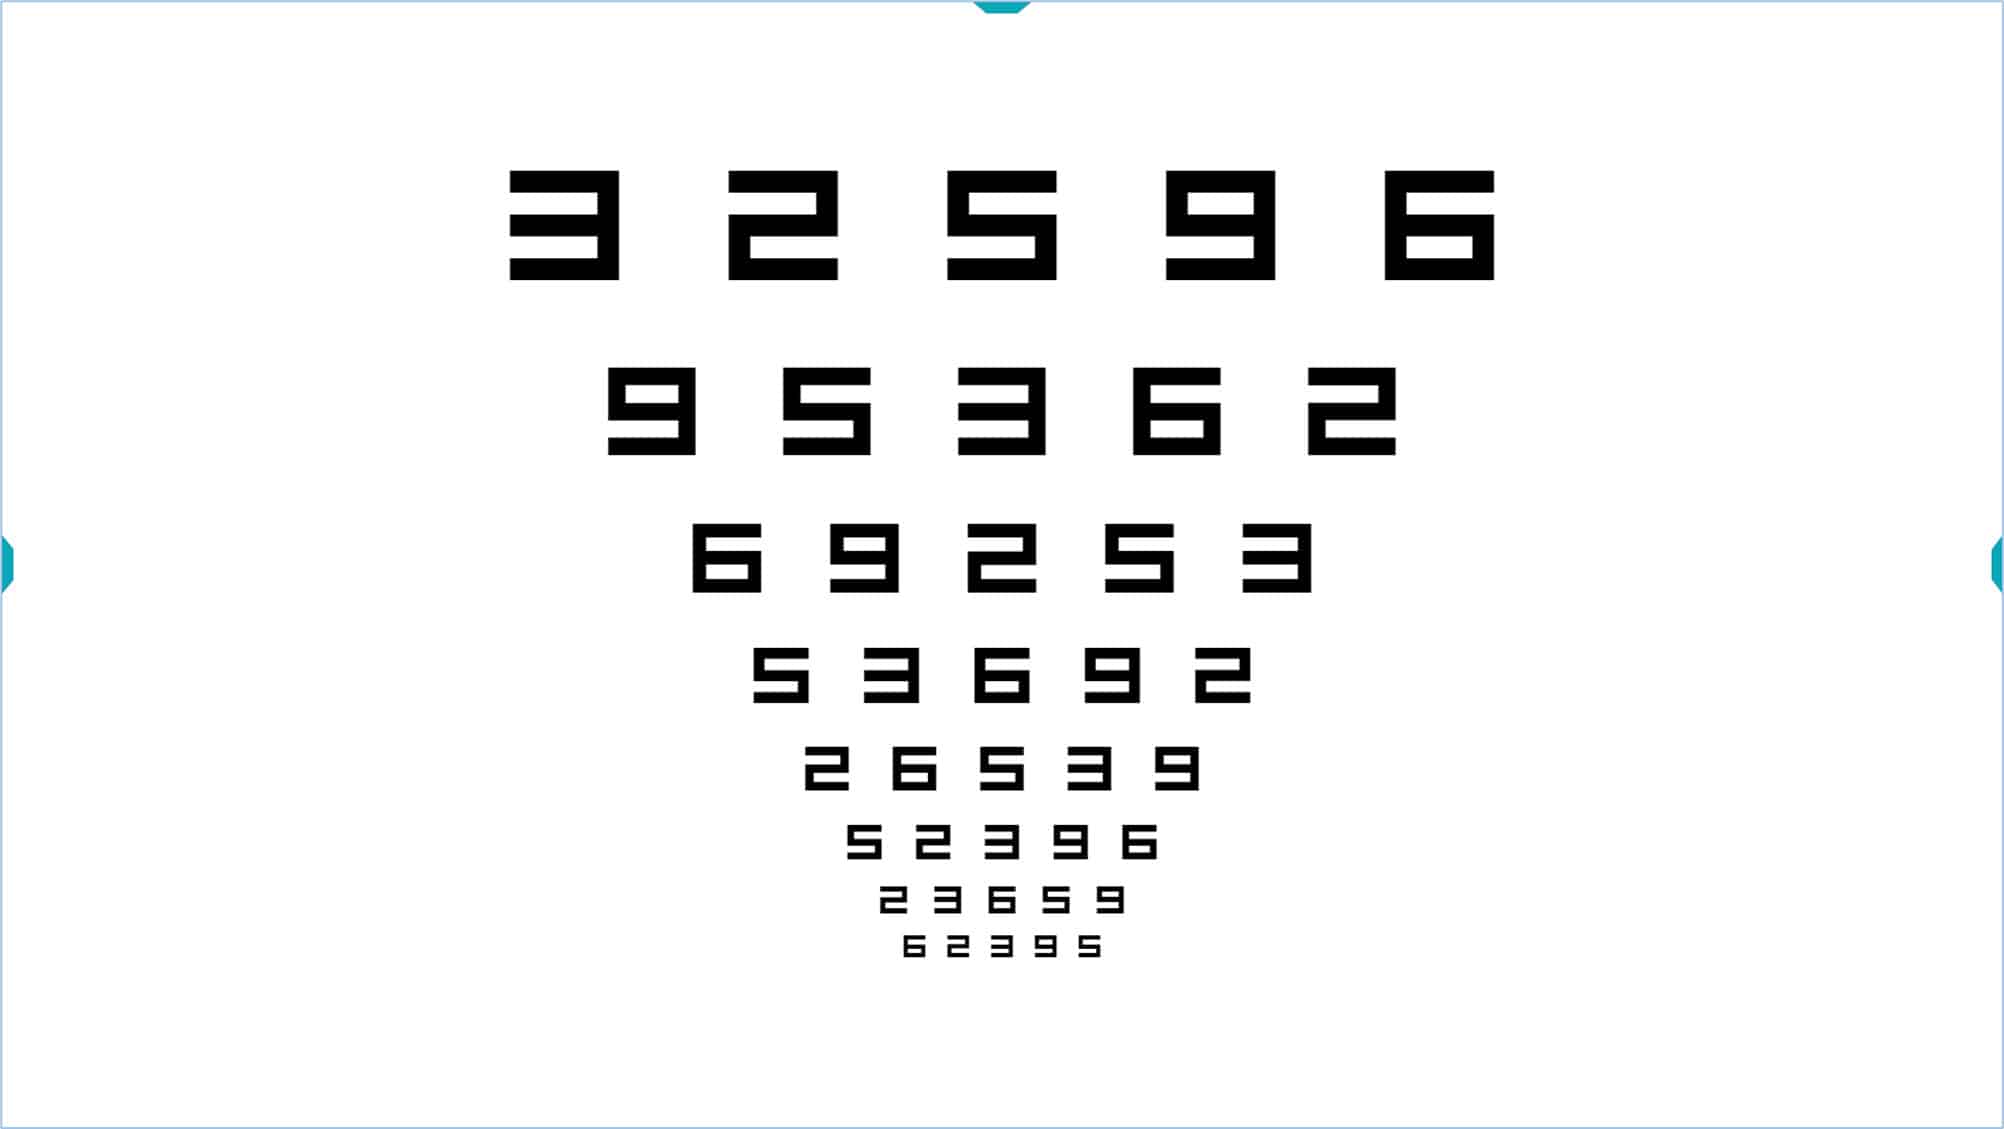
Number optotypes can be used in patients with communication difficulties when using letters (for example, in people who speak another language). They could also be used on young children, although letter charts are recommended as soon as possible. The “Broken Glasses” test is another option for children, which we will describe later.
Landolt Optotype “C” #
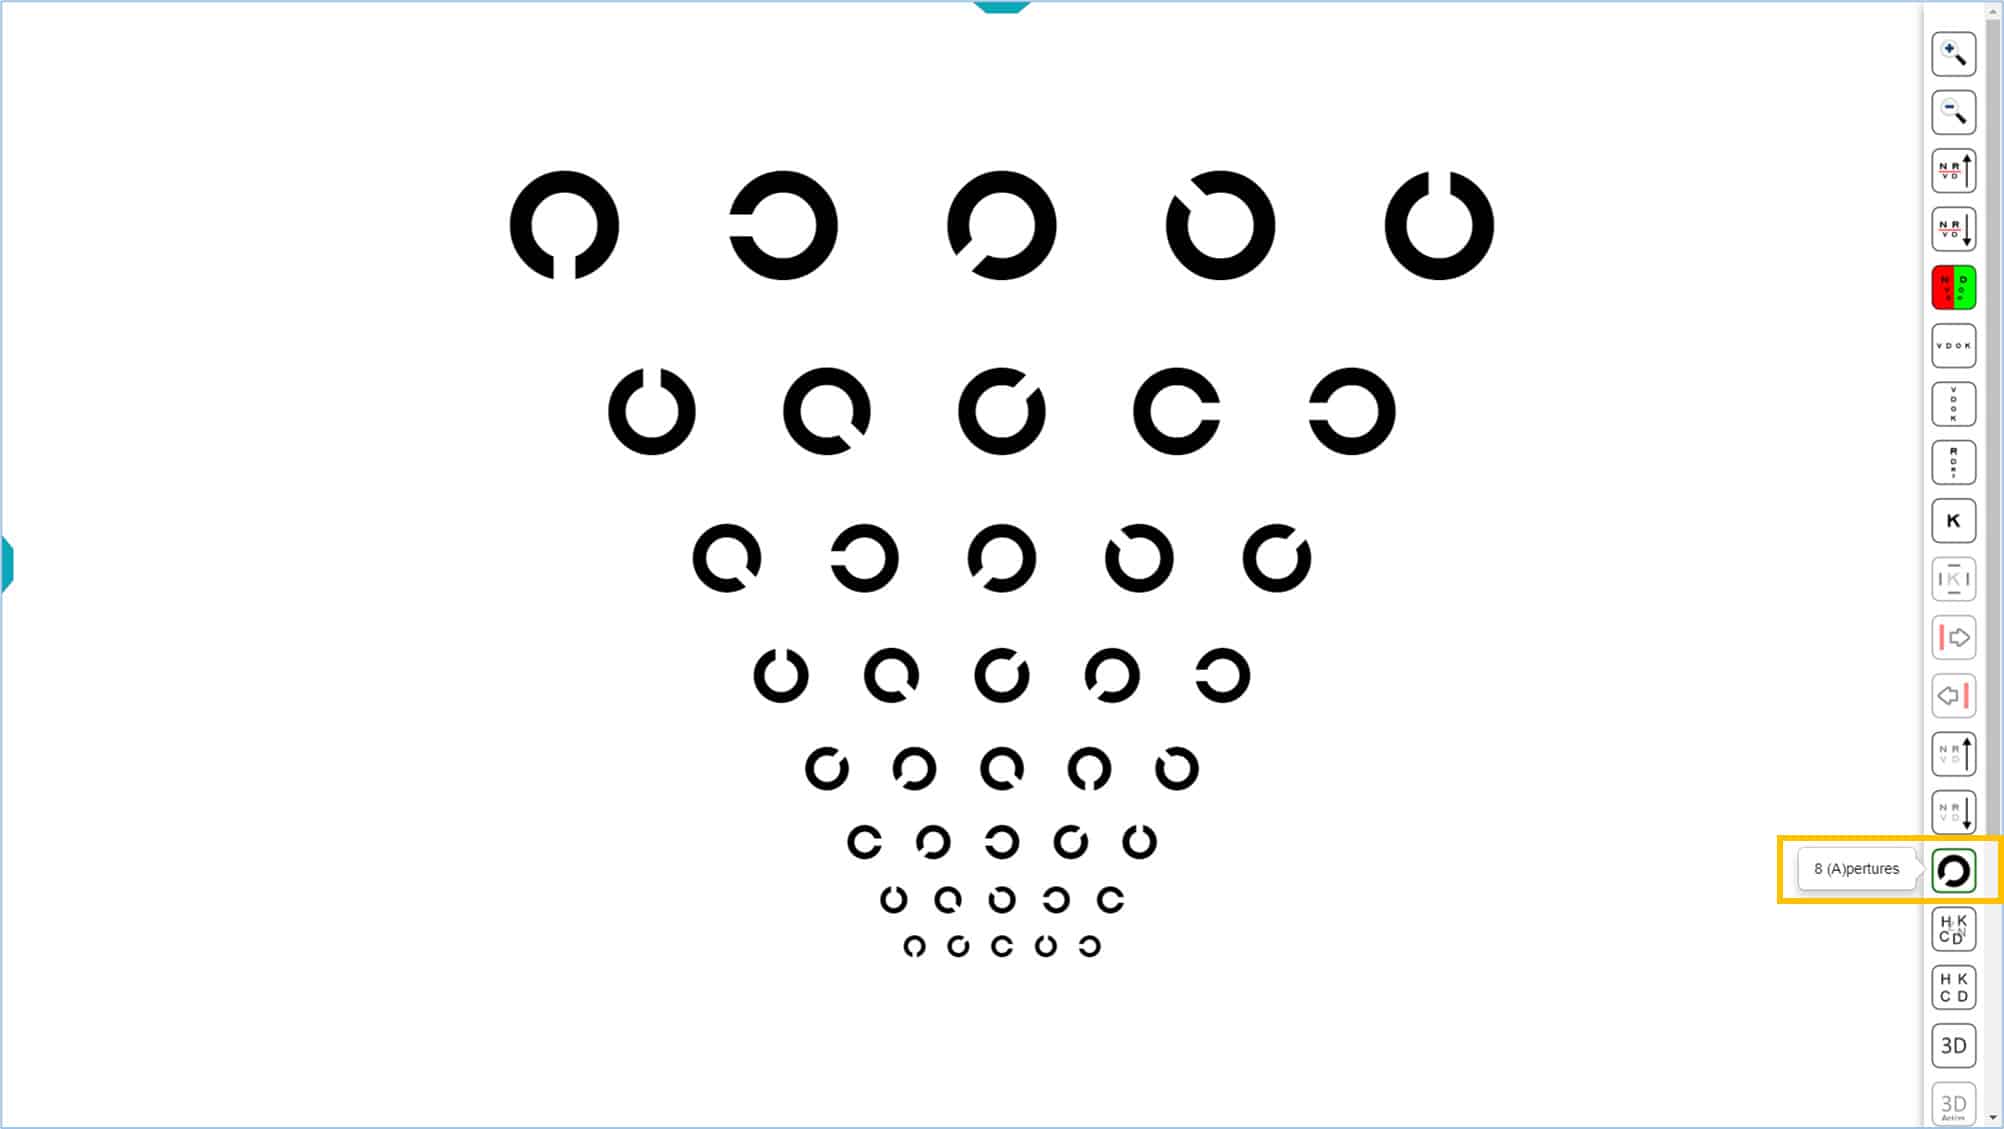
The program also includes a Landolt “C” chart. The Landolt “C” optotype has traditionally been considered the standard in the measurement of VA, from which the other optotypes should be calibrated. (8) Five orientations of the gap in the Landolt “C” are used: right, left, up, down and diagonal (at 45 degrees).
By pressing an icon in the tools menu (or the P key) additional oblique orientations can be added (135, 225 y 315º) for a total of eight positions. The additional options reduce the likelihood of guessing correctly. This chart conforms to the ISO 8596 standard, which recommends using 8 orientations.
![]()
The Landolt “Cs” can be used in patients who cannot complete a letter chart. This is not recommended for children because most cannot reliably indicate the different orientations before about 7 years of age.
Tumbling E #
This optotype uses the Snellen “E” drawn on a 5×5 matrix. The E can be oriented in one of the 4 positions (left, right, up and down).
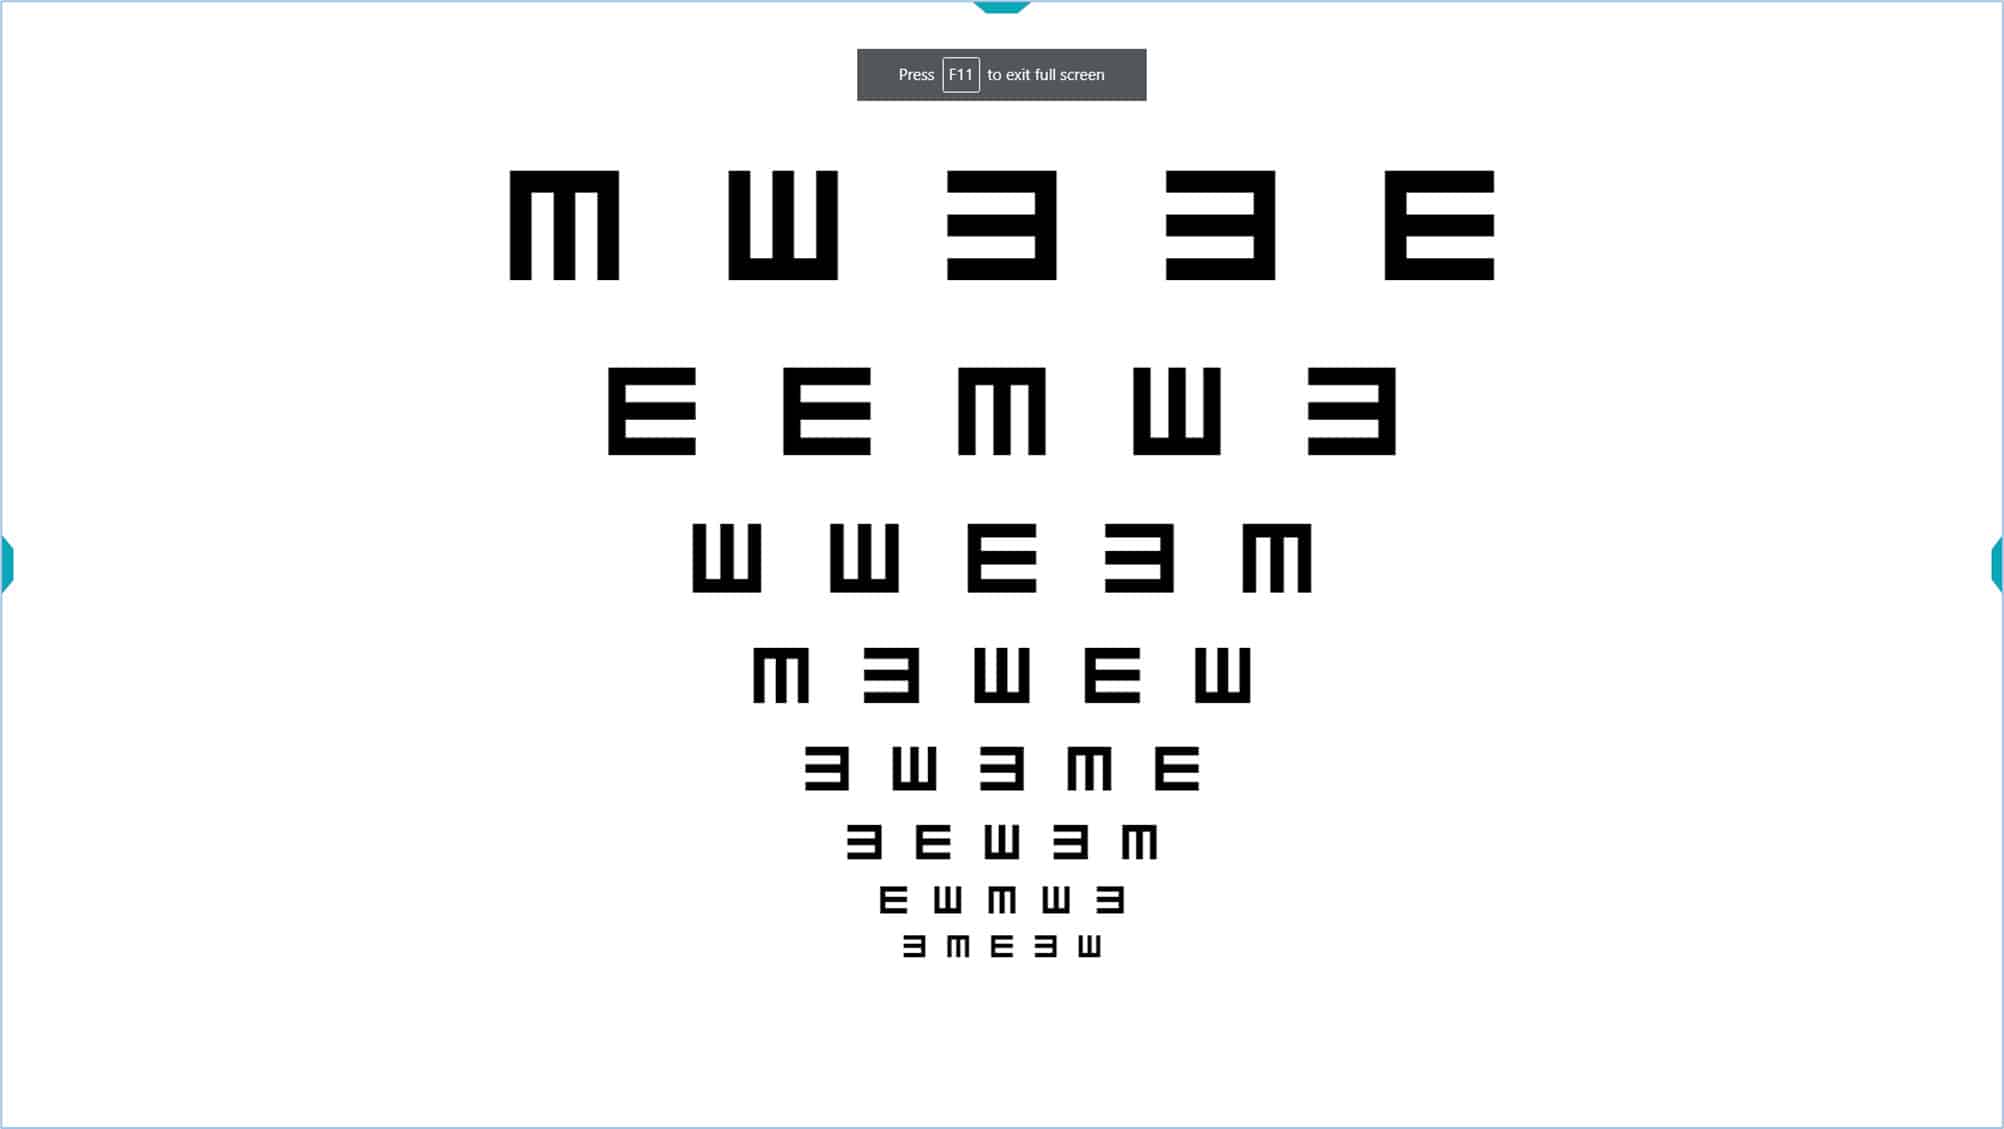
Snellen “Es” have traditionally been used in children, although many children cannot correctly identify these four orientations. In addition, Snellen’s “E’s” are similar to grating acuity, which appear to be less sensitive for identifying amblyopia than recognition acuity.
References #
1. Bailey, I. L. & Lovie, J. E. New design principles for visual acuity letter charts. Am. J. Optom. Physiol. Opt. 53, 740–5 (1976).
2. Bailey, I. L. & Lovie-Kitchin, J. E. Visual acuity testing. From the laboratory to the clinic. Vision Res. (2013). doi:10.1016/j.visres.2013.05.004
3. Sonksen, P. M., Wade, A. M., Proffitt, R., Heavens, S. & Salt, A. T. The Sonksen logMAR test of visual acuity: II. Age norms from 2 years 9 months to 8 years. J. AAPOS Off. Publ. Am. Assoc. Pediatr. Ophthalmol. Strabismus Am. Assoc. Pediatr. Ophthalmol. Strabismus 12, 18–22 (2008).
4. Shah, N. et al. Visual acuity loss in patients with age-related macular degeneration measured using a novel high-pass letter chart. Br. J. Ophthalmol. (2016). doi:10.1136/bjophthalmol-2015-307375
5. Patel, P. J., Chen, F. K., Rubin, G. S. & Tufail, A. Intersession repeatability of visual acuity scores in age-related macular degeneration. Invest. Ophthalmol. Vis. Sci. 49, 4347–4352 (2008).
6. Ferris, F. L., 3rd, Kassoff, A., Bresnick, G. H. & Bailey, I. New visual acuity charts for clinical research. Am. J. Ophthalmol. 94, 91–96 (1982).
7. Ferris, F. L., Freidlin, V., Kassoff, A., Green, S. B. & Milton, R. C. Relative letter and position difficulty on visual acuity charts from the Early Treatment Diabetic Retinopathy Study. Am. J. Ophthalmol. 116, 735–740 (1993).
8. Universale, C. O. & Committee, V. F. Visual Acuity Measurement Standard – International Council of Ophthalmology. 1–18 (1988).
9. Bennett, A. G. Ophthalmic test types. A review of previous work and discussions on some controversial questions. Br. J. Physiol. Opt. 22, 238–71 (1965).