We start with the measurement of Heterophoria, which consists of 3 charts, each with its respective icons.

Vertical Prism #
The “Vertical Prism” is the first chart and involves a prismatic scale calibrated for the chosen viewing distance, the same distance we have set for the other refractive tests. The scale’s measurement range will vary depending on the chosen distance and the screen size we use. For example, for a 23” monitor and a viewing distance of 4 meters, the prismatic scale will cover a range from 6 ∆ of Exophoria to 6 ∆ of Esophoria. As most distance phoria are small, it is expected that this scale will be sufficient in most cases.

Procedure #
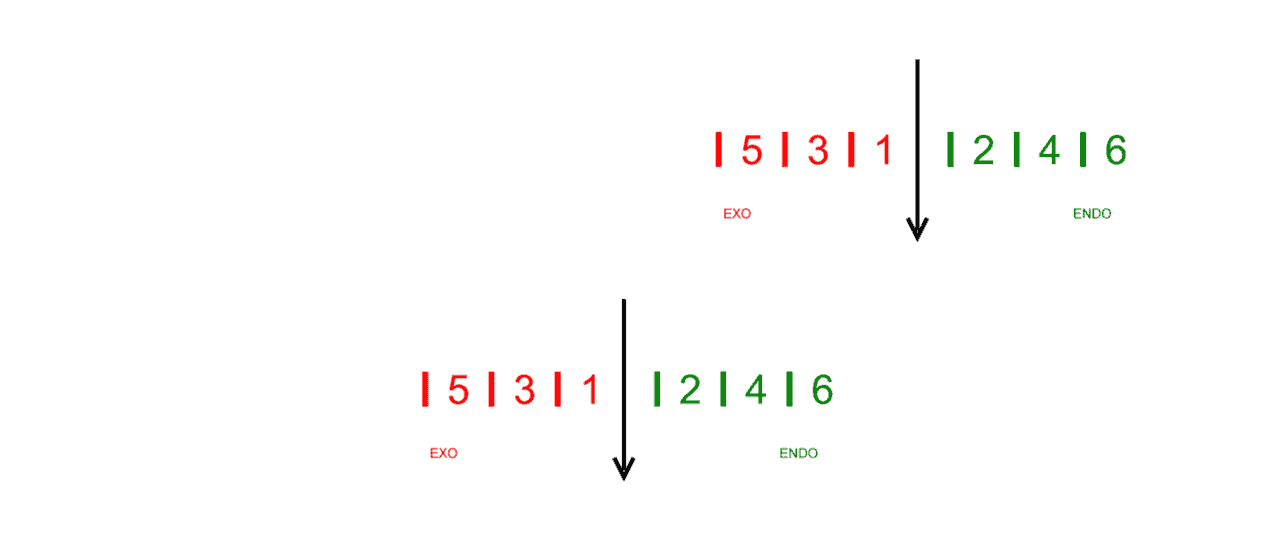
To perform the test, we place a vertical prism in front of the right eye*, with about 6∆ (prismatic diopters) base down. This way, the patient will observe two prismatic scales, one above the other. We ask them to indicate where the black arrow of the top scale points on the bottom scale. The number on the lower scale will indicate the amount and direction of the phoria. (In the following example, 2 ∆ of Exophoria).

*It’s important to keep the prism in the correct position, as any rotation of the prism will induce a horizontal prismatic effect that can lead to an error in measuring the deviation.
Subjective Cover Test #
Many individuals unconsciously attempt to merge the two scales by moving their eyes to align them. To counteract this and achieve a more accurate measurement, the right eye can be occluded for a few seconds. Immediately after removing the occluder, inquire about the position of the upper arrow (“Subjective Cover Test”). This approach minimizes the patient’s involuntary eye adjustments, providing a true reflection of their heterophoria state.
The numbers on the right side, intended for measuring esodeviations, are even and colored green, while those for exodeviations are odd and red. This colour-coding aids in verifying the patient’s responses with ease.
High Phorias #
For significant phorias that surpass the prismatic scale’s display, the upper scale’s black arrow may not align with any number on the lower scale. In such scenarios, it’s beneficial to ask the patient which number directly aligns beneath one of the upper scale’s numbers, to approximate the phoria’s magnitude.
For instance, if the number 3 from the upper scale aligns directly above the number 6 on the lower scale, adding these values indicates a deviation of approximately 9 ∆ of esophoria (inward deviation) for this patient.
Tool Menu #
The tool menu includes a pair of zoom icons to increase and decrease the numbers’ size with a factor of x1.25 (or using the “+” and “-” keys). There are also 2 icons to increase or decrease the thickness of the black arrow (or with the “Ctrl +” and “Ctrl -” keys respectively). The size we have chosen in the last execution of the program will be saved for the next session. This function is useful for adjusting the size of the numbers and the thickness of the lines that are most suitable for each clinic.

Near Vision #
To ensure that the patient accommodates correctly in near vision, we will ask them to keep the numbers of the scale always sharp.
We can also ask the patient to alternate the gaze between the upper and lower scale to check if the deviation varies when fixing with one eye or the other.

A 10-inch tablet allows displaying a range of measurements between 25 ∆ of Exophoria and 25 ∆ of Esophoria.
Use #
The prismatic scale allows us to measure the horizontal heterophoria with the help of a vertical prism and the AC/A ratio using the Gradient technique.
Horizontal Maddox Rod #
This chart consists of a prismatic scale calibrated to the chosen viewing distance to measure the horizontal deviation with the Maddox rod. Like in the previous Vertical Prism chart, the range of measurements will vary depending on the viewing distance and the screen size.
The numbers on the right corresponding to esodeviations are even and green, while for exodeviations they are odd and red. This distinction will help us confirm the patient’s response during the test.

Tool Menu #
The tool menu includes a pair of zoom icons to increase and decrease the numbers’ size with a factor of x1.25 (or using the “+” and “-” keys). There are also 2 icons to increase and decrease the thickness of the central white bar. The size chosen in the last execution of the program will be saved for the next session.

Procedure #
For conducting the test, we place a Maddox rod in front of the patient’s right eye so that the “grooves” are horizontal. The central white bar will thus become a vertical white line (it is recommended to use a translucent, colorless Maddox rod). To assist the patient in locating this line, we can make it blink on the screen for 3 seconds by pressing the icon in the tool menu or the “P” key on the keyboard.

With both eyes open, the patient must indicate where the bright line crosses the number scale seen with the other eye. In this example, the measurement is 2 ∆ (prismatic diopters) of Exophoria.

The accuracy of the measurement can be improved by covering the right eye with an occluder for a few seconds and asking for the position of the line just at the moment the occluder is removed (“Subjective Cover Test”). This is very useful for patients who see the line oscillating from one side to the other.
Near Vision #
Similar to the Vertical Prism chart, for near vision, we will ask the patient to keep the numbers on the scale always sharp to ensure they are accommodating correctly.
Vertical Maddox rod #
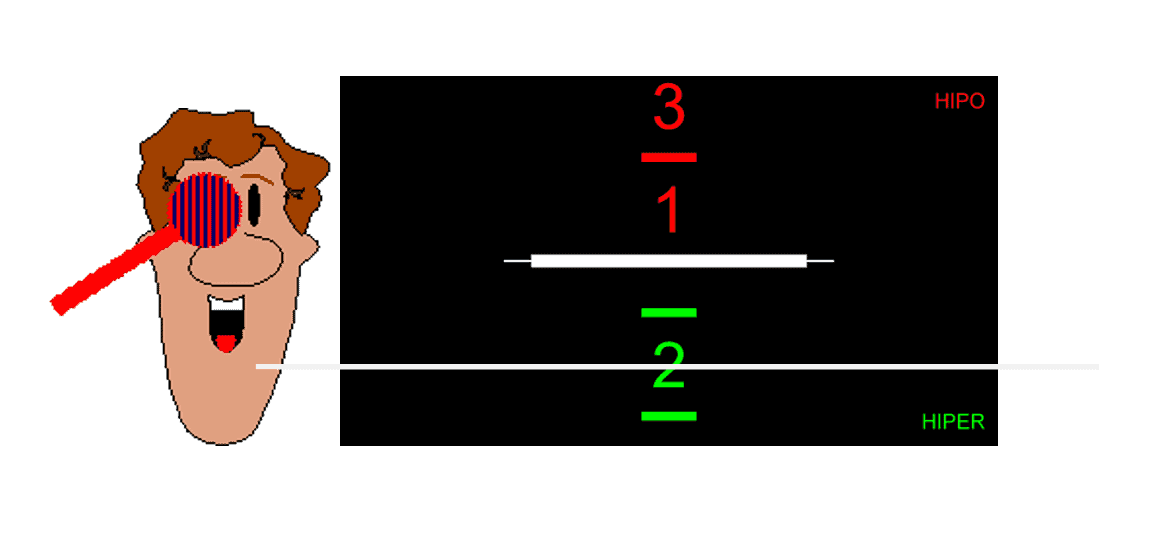
In addition to the test for measuring horizontal phoria with the Maddox rod, the Vision Unit includes another for measuring vertical phoria. It also consists of a prismatic scale calibrated for the chosen distance, whose range of measurements varies depending on the viewing distance and the size of the screen. For a 23” monitor at 4 meters, for example, the range extends from 3 ∆ of Hyperphoria to 3 ∆ of Hypophoria. The numbers on the lower part, corresponding to Hyper-deviations of the right eye, are even and green, while for “Hypo” deviations they are odd and red. This distinction will help us confirm the patient’s response during the test.

Tool Menu #
Again, we have a pair of zoom icons, or the “+” and “-” keys, to change the size of the numbers (x1.25), as well as 2 icons to increase and decrease the thickness of the central white bar. The size selected will be recorded for the next time we use this test. The tool menu includes a pair of zoom icons to increase and decrease the size of the numbers by a factor of x1.25 (or by using the “+” and “-” keys). There are also 2 icons for increasing and decreasing the thickness of the central white bar. The size chosen in the last execution of the program will be saved for the next session.

Procedure #
To measure, we place the Maddox rod in front of the right eye, making sure that the “grooves” are vertical. The central white bar will thus become a horizontal white line (again, a translucent Maddox rod is recommended). To help the patient locate this line, we can make it blink on the screen for 3 seconds by pressing the corresponding icon or the “P” key on the keyboard.
With both eyes open, the patient must tell us where the bright line crosses the number scale seen with the other eye. In this example, it would be 2 ∆ of Hyperphoria of the right eye. If the line moves upwards, we would have a Hypophoria of the right eye, as indicated on the prismatic scale.
Sometimes, it’s advisable to cover the right eye (RE) for a few seconds, allowing the patient to indicate the exact position of the bright line immediately upon removing the occluder (“Subjective Cover Test”).
I am an orthoptic student at the University of Liverpool. I am doing my thesis on the topic of comparison of measurement of heterophoria using PCT and Optonet. Can I know if there are any studies relating to the accuracy of Optonet in the measurement of heterophoria?
Dear Jessin,
It is a pleasure to hear from you, and thank you for getting in touch.
As you will have seen there, Optonet provides two standard clinical approaches for subjective heterophoria assessment:
• Modified Thorington (Maddox method)
• Howell Card (using a Vertical Prism)
Both are well-established procedures in clinical optometry and orthoptics. While we have not published Optonet-specific validation studies on these tests, our implementation is grounded in extensive internal testing and faithful adherence to these accepted clinical methods.
For your thesis background and comparative analysis (e.g., against the Prism Cover Test), the following peer-reviewed studies are often cited regarding the repeatability and agreement of subjective heterophoria methods:
• Rainey BB, Schroeder TL, Goss DA, Grosvenor TP. Inter-examiner repeatability of heterophoria tests. Optom Vis Sci. 1998;75:719–726.
• Cebrián JL, Antona B, Barrio A, González E, Gutiérrez Á, Sánchez I. Repeatability of the modified Thorington card used to measure far heterophoria. Optom Vis Sci. 2014;91:786–792.
• Wong EP, Fricke TR, Dinardo C. Interexaminer repeatability of a new, modified Prentice card compared with established phoria tests. Optom Vis Sci. 2002;79:370–375.
• Casillas EC, Rosenfield M. Comparison of subjective heterophoria testing with a phoropter and trial frame. Optom Vis Sci. 2006;83:237–241.
If you intend to compare PCT and Optonet heterophoria measures, I would recommend occluding one eye for 15–20 seconds during testing (subjective cover test) to allow partial relaxation of tonic vergence. Immediately after uncovering, ask the subject about the position of the upper arrow (for the vertical prism test) or the bright line across the scale (for the Maddox rod test). This minimizes involuntary fusion adjustments and yields a more accurate representation of the heterophoria. (See section: Subjective cover test: https://optonet.es/docs/heterophoria/?lang=en#subjective-cover-test)
If your PCT protocol uses the alternating cover test, you can apply a similar alternating occlusion when using the Maddox or Vertical Prism tests. Keep in mind that alternating cover tests typically reveal larger heterophorias than cover–uncover methods, as binocular vision is fully suspended during alternation. Therefore, ensuring methodological equivalence between the tests will strengthen your comparison.
Finally, if you wish, we can arrange a short remote session to go through the heterophoria testing workflows on Optonet and clarify any points regarding your research protocol. You can book a convenient time here:
📅 Book a session: https://outlook.office365.com/book/OptonetLtdEn@optonetltd.onmicrosoft.com/?ismsaljsauthenabled=true
Best wishes for your project, this is a valuable and relevant topic for orthoptic research.
Regards,
Guillermo Bueno, MSc, PhD
Director of Optonet Ltd.
Email: optonet@optonetproject.com
Warrington, UK
https://optonet.online/