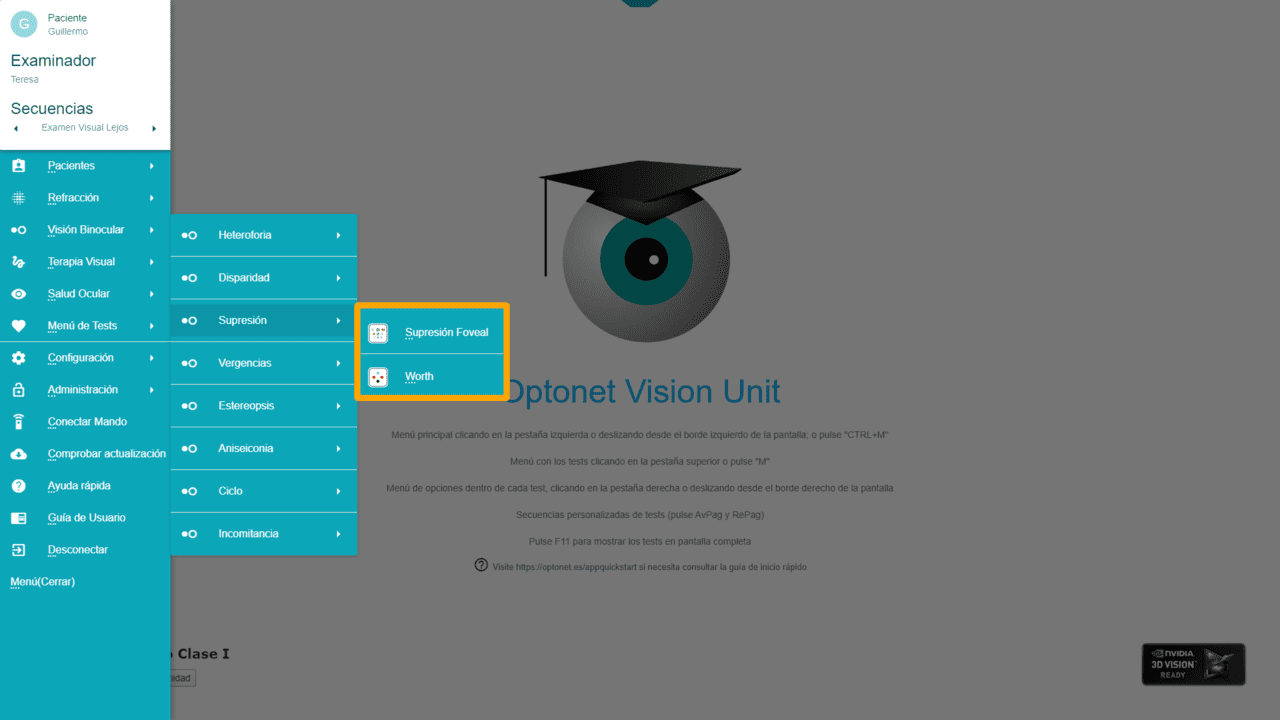
The next section of binocular vision is Suppression, which provides access to two different charts to investigate this function.
Foveal Suppression #
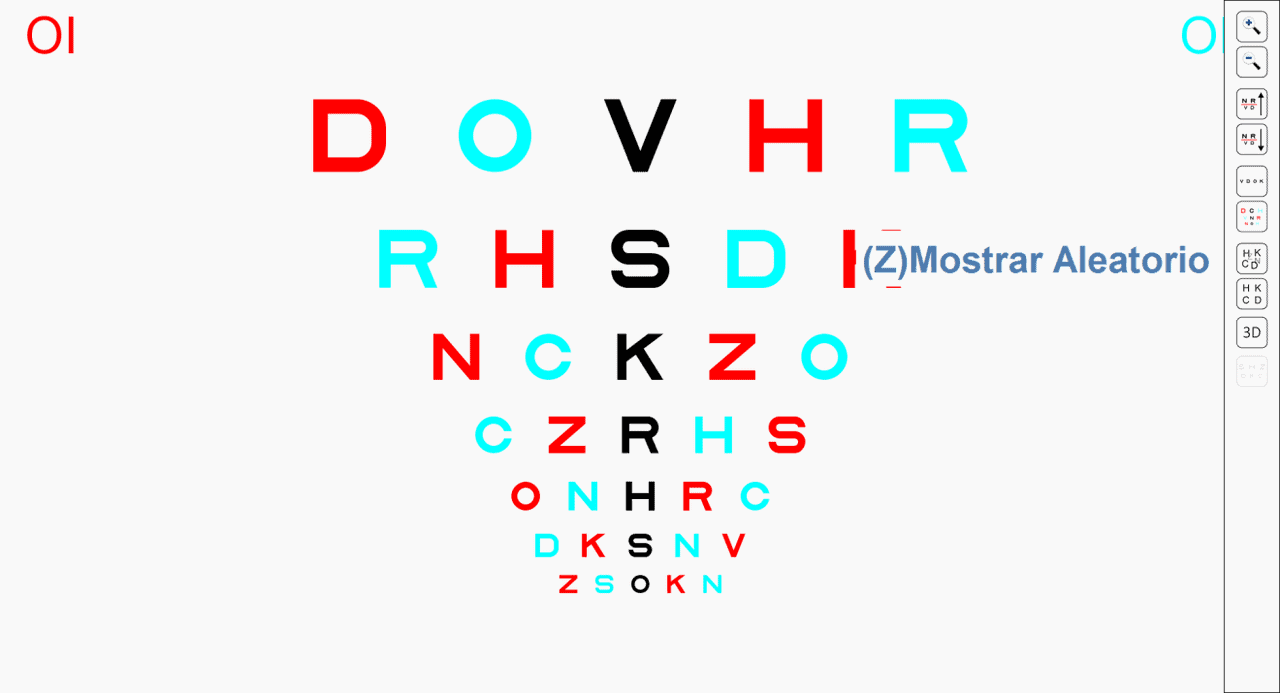
The foveal suppression chart requires red/blue (or red/green) filters, with the red filter, as always, in front of the right eye. It consists of the same Sloan letter visual acuity chart, only here the only black letters are those in the central column; the rest alternate between red and blue letters. The red letters are only seen by the left eye, while the blue letters are visible only with the right. The central column of black letters serves as a binocular stimulus.
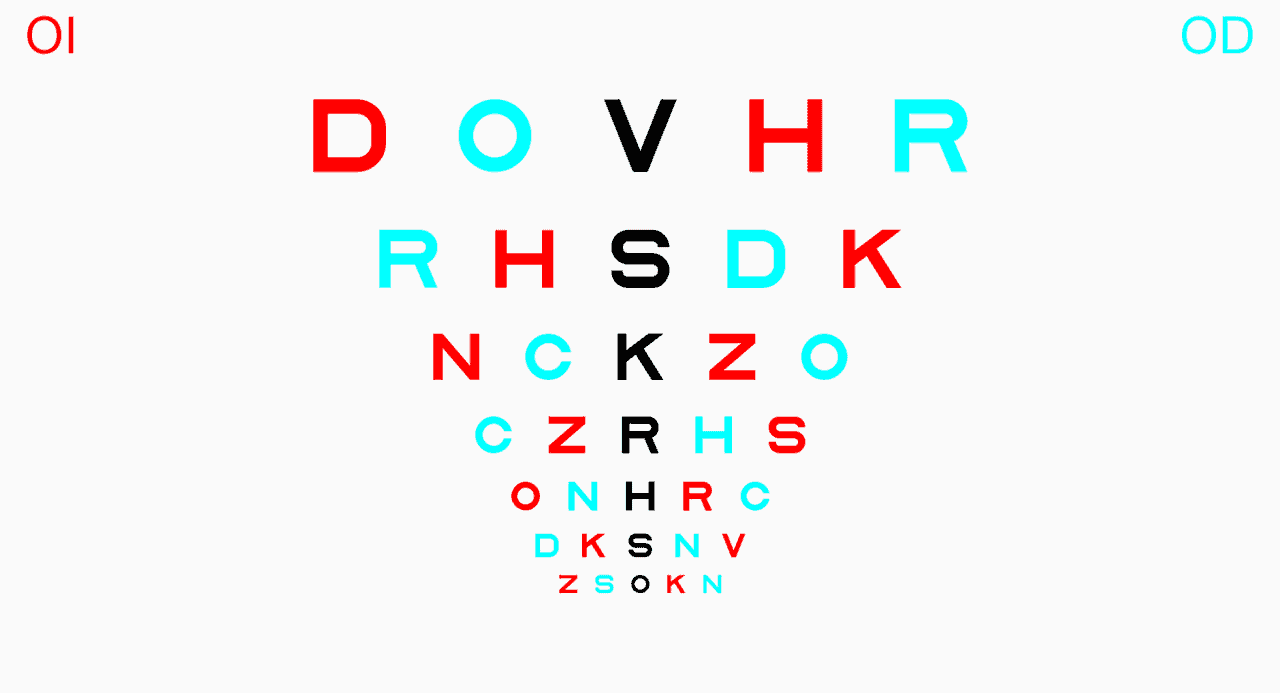
In the upper left and right of the screen, it indicates which eye sees each letter, to help interpret the test.
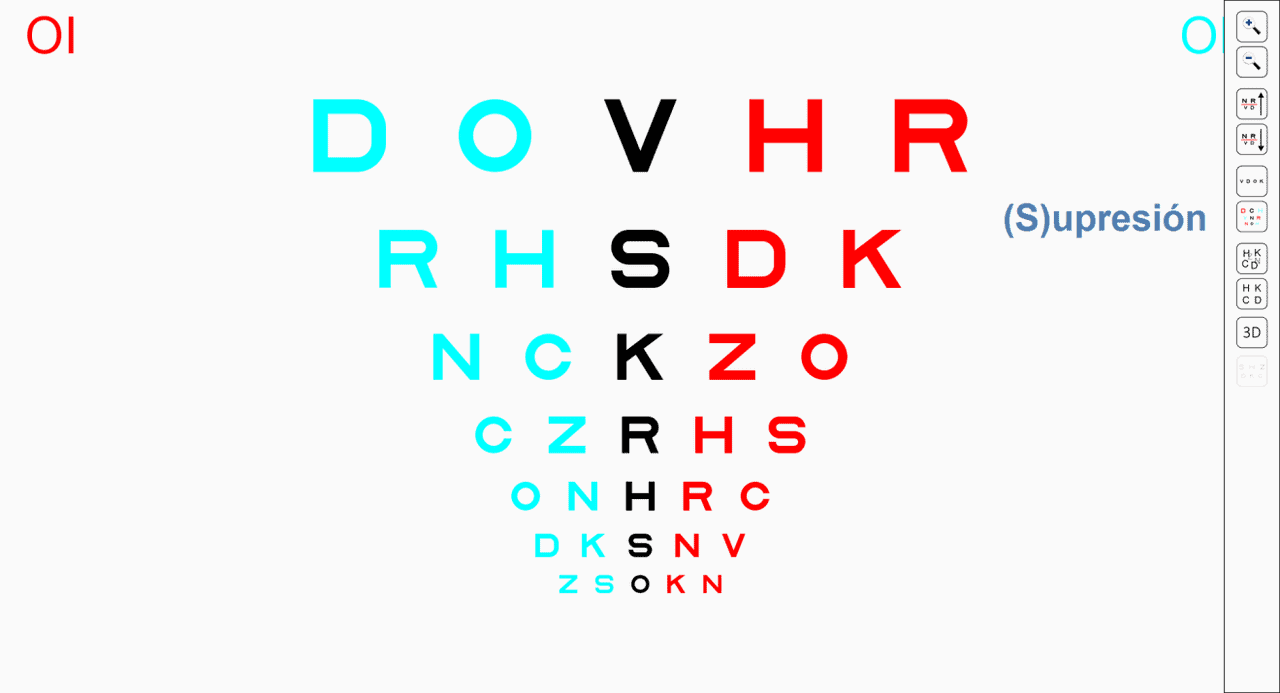
The red and blue letters are interspersed, but if we prefer to have all the red letters on one side and the blue ones on the other, we can achieve this with the corresponding button found in the tool menu. Pressing this button (or the “S” key on the keyboard) successively changes the colour scheme and then returns to the initial configuration.
Like the Visual Acuity tests, there are two icons to mark a row (with a black line):
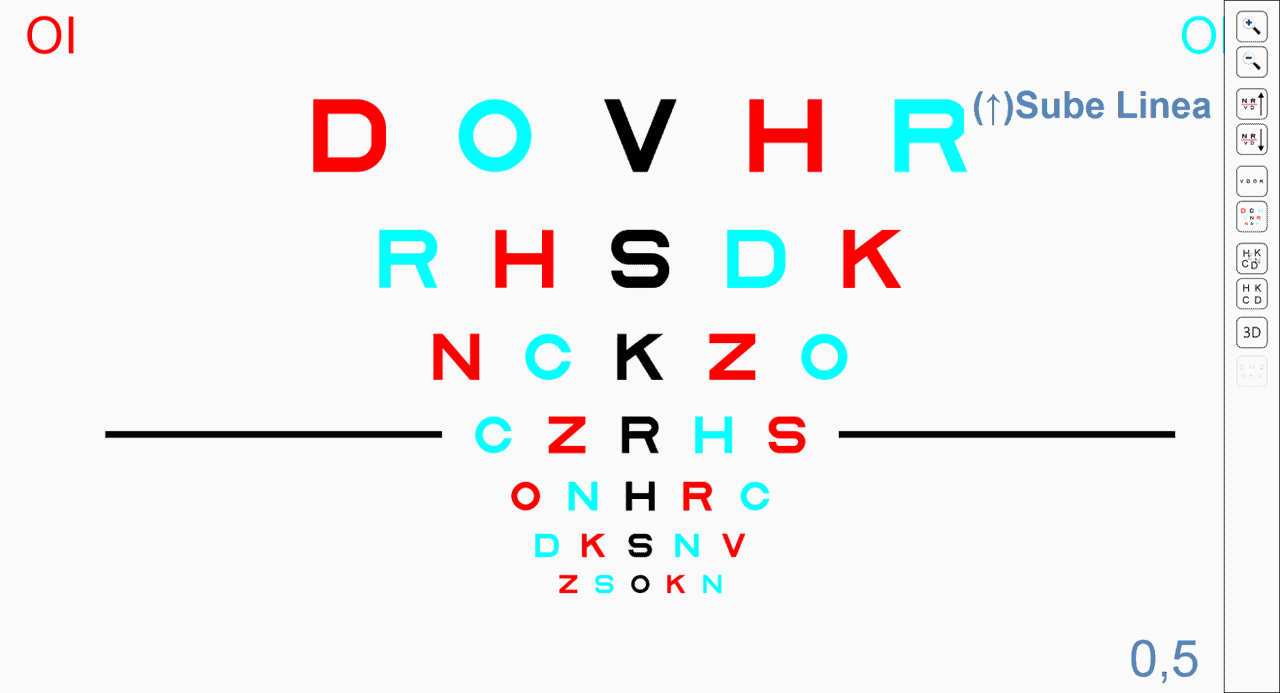
And an icon to isolate a row of letters:
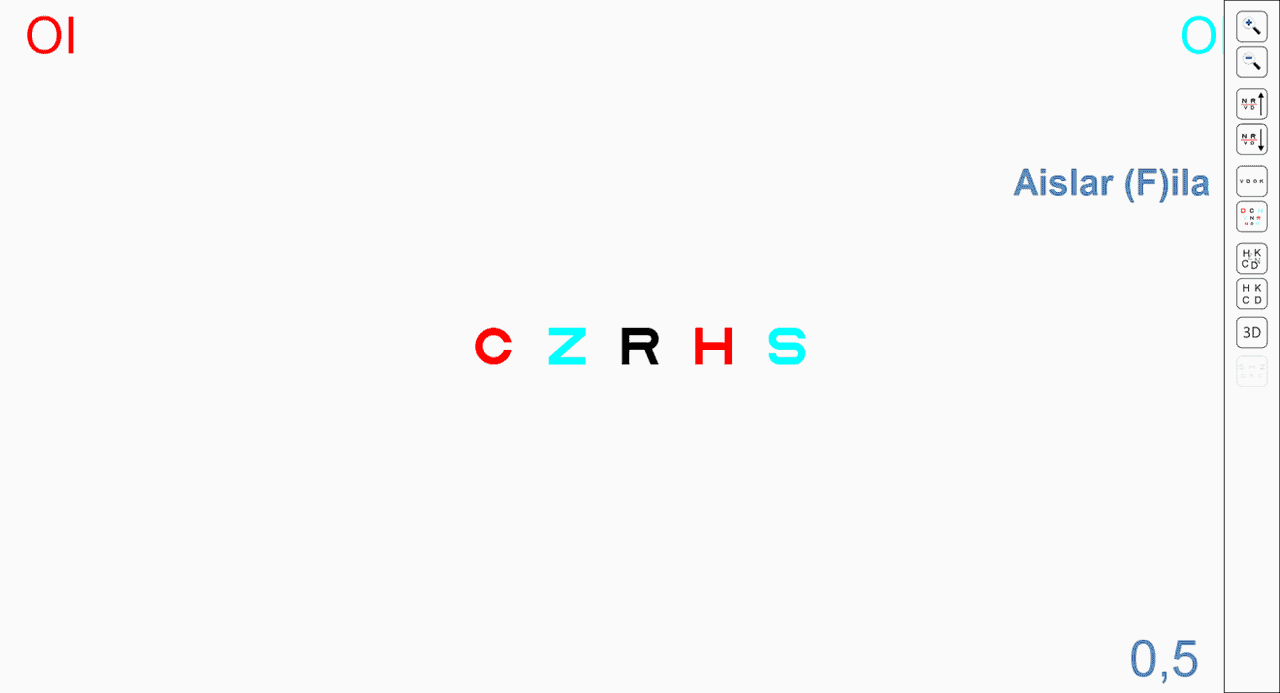
Buttons are also included to randomly modify the combination of letters.
As always, all these functions can also be accessed using the corresponding shortcut keys.
Operation #
In this test, we will ask the patient to read the letters, up to the last row. If any letter disappears, its size will give us an idea of the dimension of the suppression scotoma (expressed in AV values for the chosen viewing distance).
If the red letters disappear, the vision of the left eye is being suppressed, and vice versa if the blue letters disappear.
Use #
This test is very useful for detecting small central areas of suppression and determining their size. These small suppression areas occur in decompensated heterophorias, anisometropia, and microtropia.
Worth Dot Test #
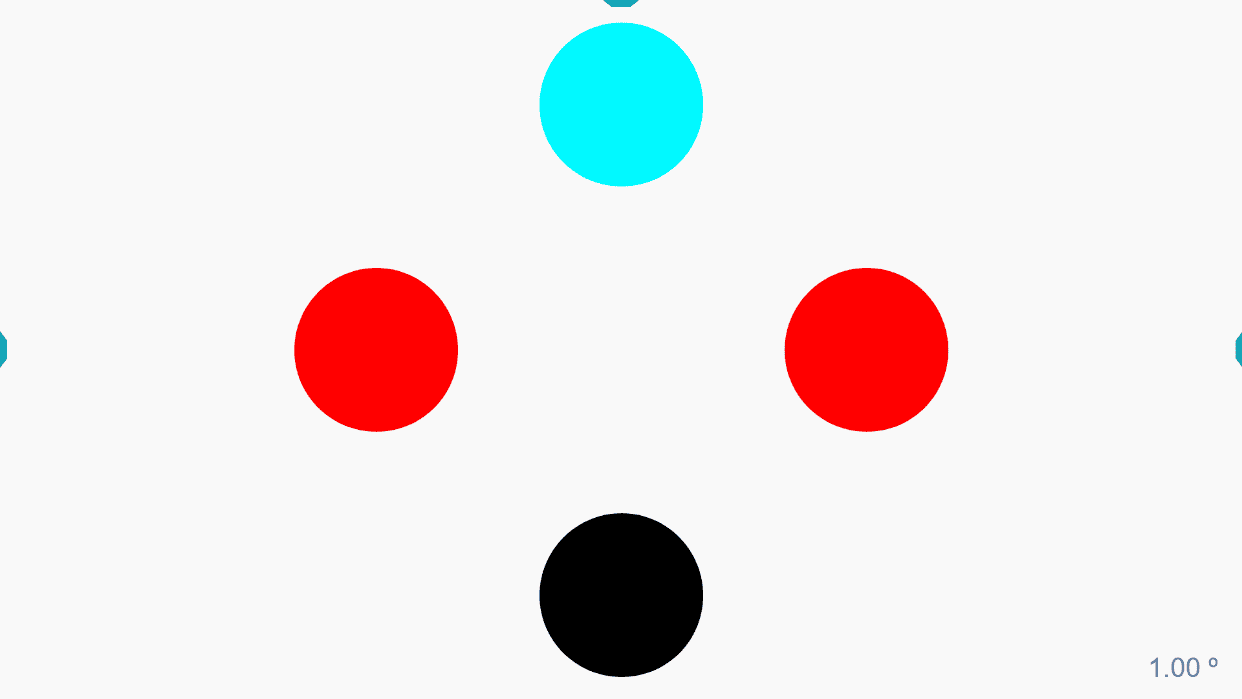
A Worth dot test is also included to investigate suppression. This chart requires red/blue or red/green filters (red always goes in the RE), and consists of a blue circle at the top in the centre (seen only by the RE), two red circles in the centre (seen only by the LE), and a lower black circle observed binocularly.
Each circle subtends 1 degree at the established viewing distance (this value is displayed in the lower right corner of the screen).
Two zoom icons are also included, so that each time they are pressed, the size of the test varies by a factor of x1.25.
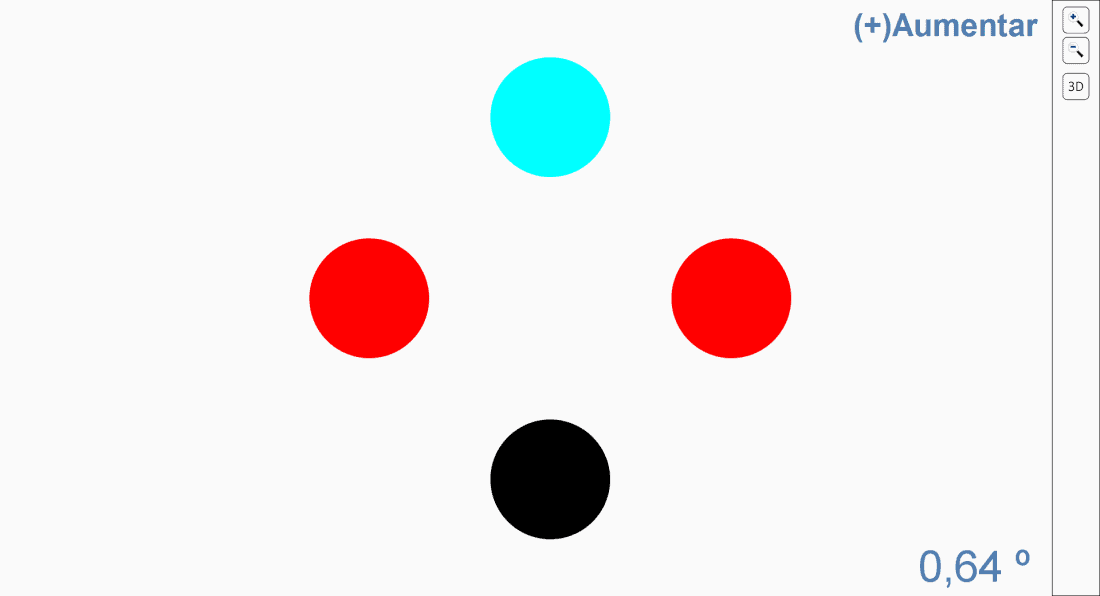
The size chosen in the last program execution will be automatically saved for the next session.