The Motor Field Test is similar to the Hess-Lancaster screen used in the study of ocular motility in paralytic or incomitant deviations.
The Motor Field Test allows for the evaluation of ocular deviation in the 9 diagnostic gaze positions for the exploration of ocular motility and the actions of the extraocular muscles in near vision.
The Motor Field Test is performed in near vision and, therefore, is only available when the Unit is calibrated for a distance of less than 1 meter.
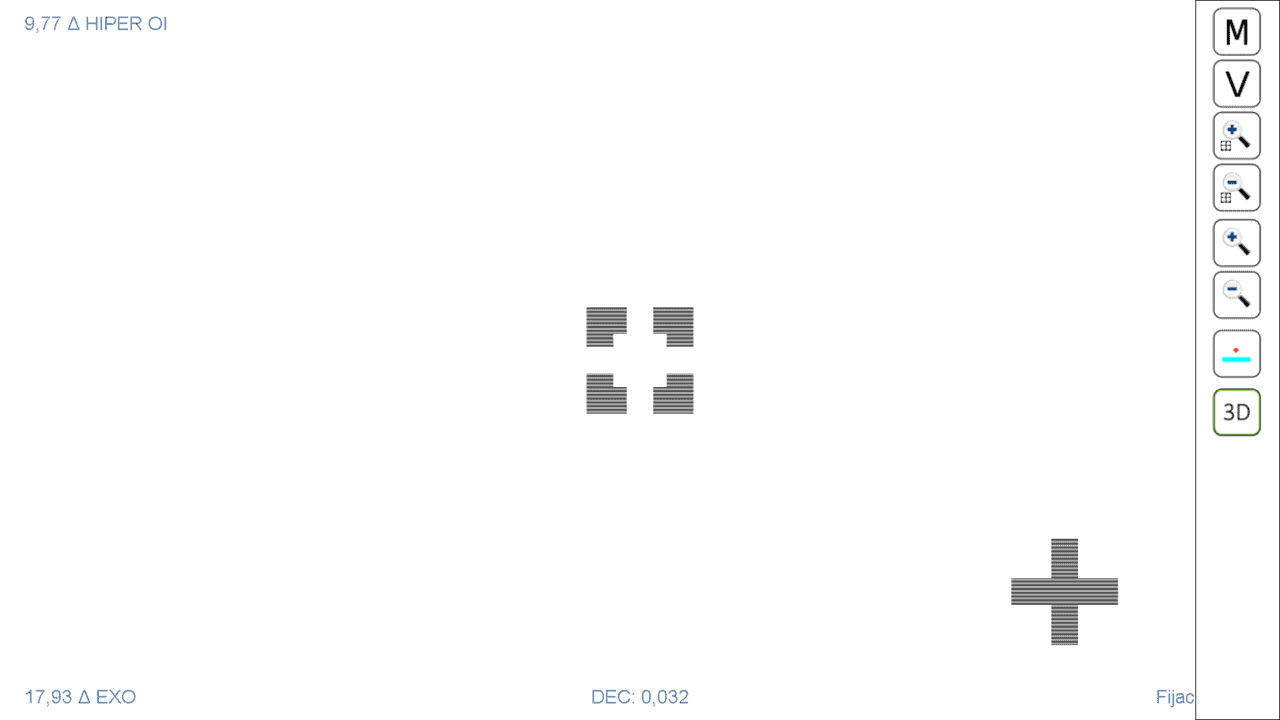
The first screen of the test displays a blue square and a red cross. With the red-blue glasses, the patient will observe the square with the right eye and the cross with the left. This first screen allows for determining the ocular deviation in the primary position of the gaze. To do this, we will ask the patient to, looking through the red-blue glasses, move the cross with the mouse and insert it into the square, until it fits in the centre. It is possible that the figures appear to move, so the patient will have to choose the best position they can.
When the cross is seen well-fitted in the centre of the square, the patient must click with the mouse (left button). Then the square and cross become fixed, and the value of the horizontal deviation (bottom left corner) and the vertical deviation (top left corner) appears on the screen; as shown in the following image.
Below, the size of the cross and the square are also displayed (in AV units). The bottom right corner indicates which eye is fixing, which is the one observing the square.
Clicking again on the left mouse button (or the “Esc” key on the keyboard) releases the cross, the values disappear, and a new measurement can be taken.
It is recommended to take at least 3 measurements to ensure that the patient has understood the test, and to average them, in case the figures appear to fluctuate.
Measurement of Deviation in the 9 Diagnostic Positions #
Clicking the mouse on the right tab of the screen (or with the Ctrl + Alt + M key combination) opens the tools menu, with the different functions of the Motor Field Test. The first “M” icon allows for the exploration of ocular deviation in the 9 diagnostic gaze positions. Clicking on this icon starts an automatic routine in which the square is shown in different positions on the screen, for the patient to insert the cross inside. 9 measurements will be taken for each eye, one for each diagnostic position. It starts with the right eye fixing.
This routine can also be started by pressing the “F” key on the keyboard – Motor (F)ield.
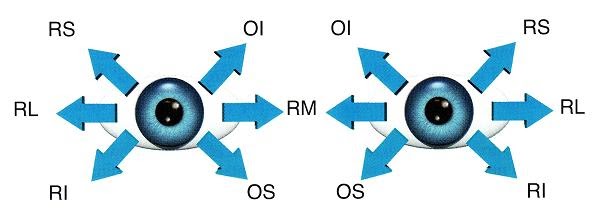
The test evaluates the deviation in the 9 diagnostic positions in the following order: top left, top centre, top right, centre left, centre, centre right, bottom left, bottom centre, bottom right:
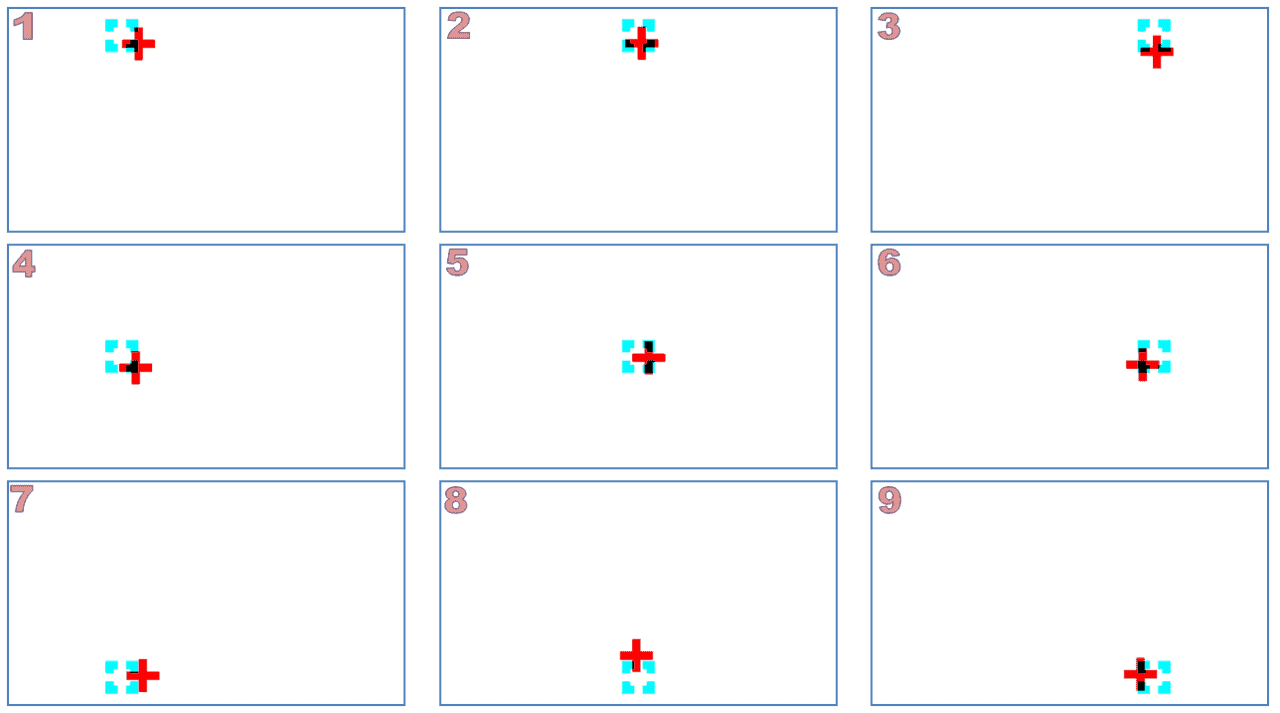
Figure 1. The test evaluates the deviation in the 9 diagnostic positions in the following order: top left, top centre, top right, centre left, centre, centre right, bottom left, bottom centre, bottom right.
Then, the same process is repeated, but changing the fixing eye, and finally, the results screen is displayed.
Results Screen #
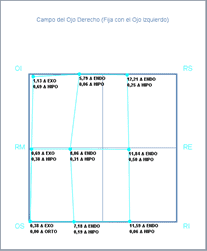
The results screen indicates the horizontal and vertical deviation for each of the 9 diagnostic positions of each eye, as well as the muscle of greatest action (principal) in each of the positions.
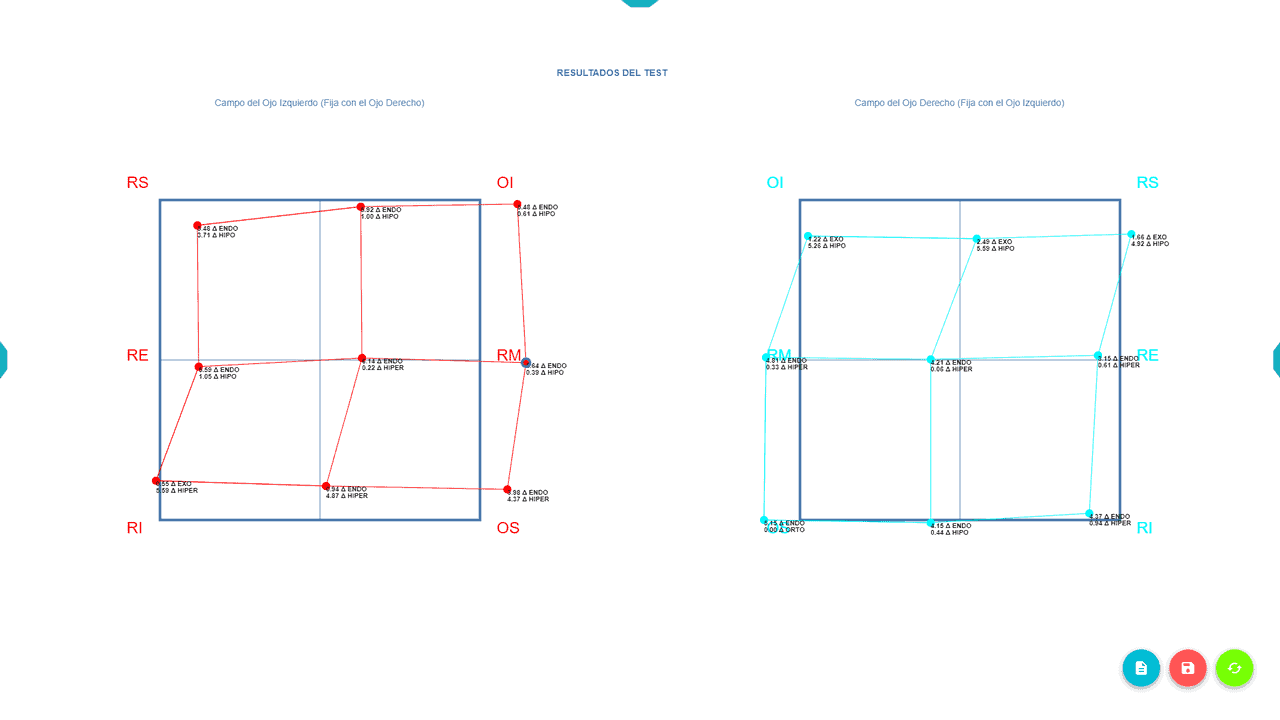
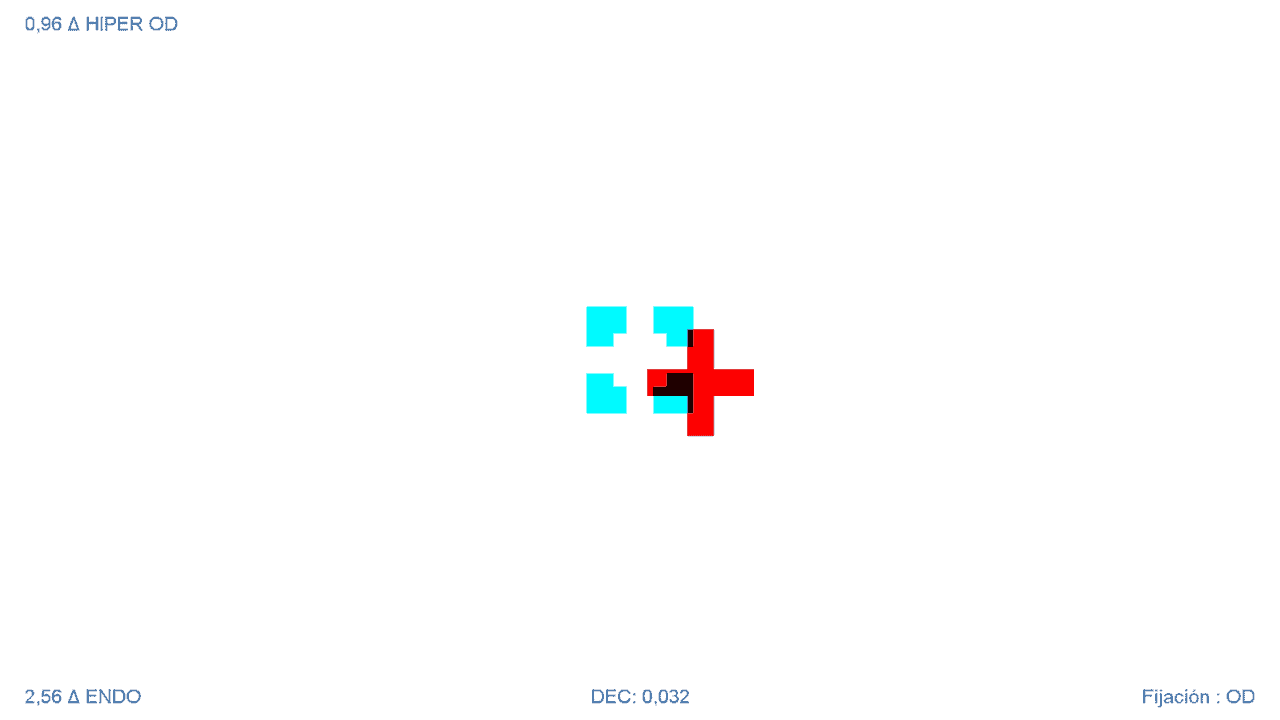
The dark blue squares represent the diagnostic positions evaluated. The graph in red corresponds to the first measurement (fixing the RE), and the light blue on the right is from the second measurement (fixing the LE). The points in red or light blue correspond to the position where the patient placed the cross to overlay it on the square.
When the right eye is fixing, we are assessing if the left eye directs its gaze in the same direction as the RE; that is, by fixing the RE, we study the motor field of the left eye, and vice versa. Thus, the graph on the right evaluates the motor field of the RE, and the graph on the left evaluates the field of the LE.
If both eyes are perfectly aligned, the responses will approximately coincide with the 9 vertices of the dark blue squares. But if the eyes have a deviation in one direction of the gaze, the patient’s response will not coincide with the square’s vertex, and the greater the deviation, the further it will be from that vertex.
At each point on the graph, the vertical and horizontal deviation that the patient presents when looking in that direction is indicated next to it, in prism diopters. For example:
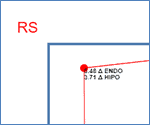
This way, the test calculates the measure of horizontal and vertical deviation for each of the 9 diagnostic positions, depending on which eye is fixing. Additionally, it indicates which muscle is of greatest action (or principal action) in each position: the Left Superior Rectus in the previous image.
Motility Field #
This way of presenting the results helps to understand paralyses or motility disorders intuitively. It is easier to follow an example to understand it:
Example – RE Sixth Nerve Palsy #
Let’s suppose a recent paralysis of the external rectus of the right eye (innervated by the sixth nerve). This patient will not be able to move their right eye outward (in abduction). If we perform the motor field test on this patient, we would obtain a result similar to this:
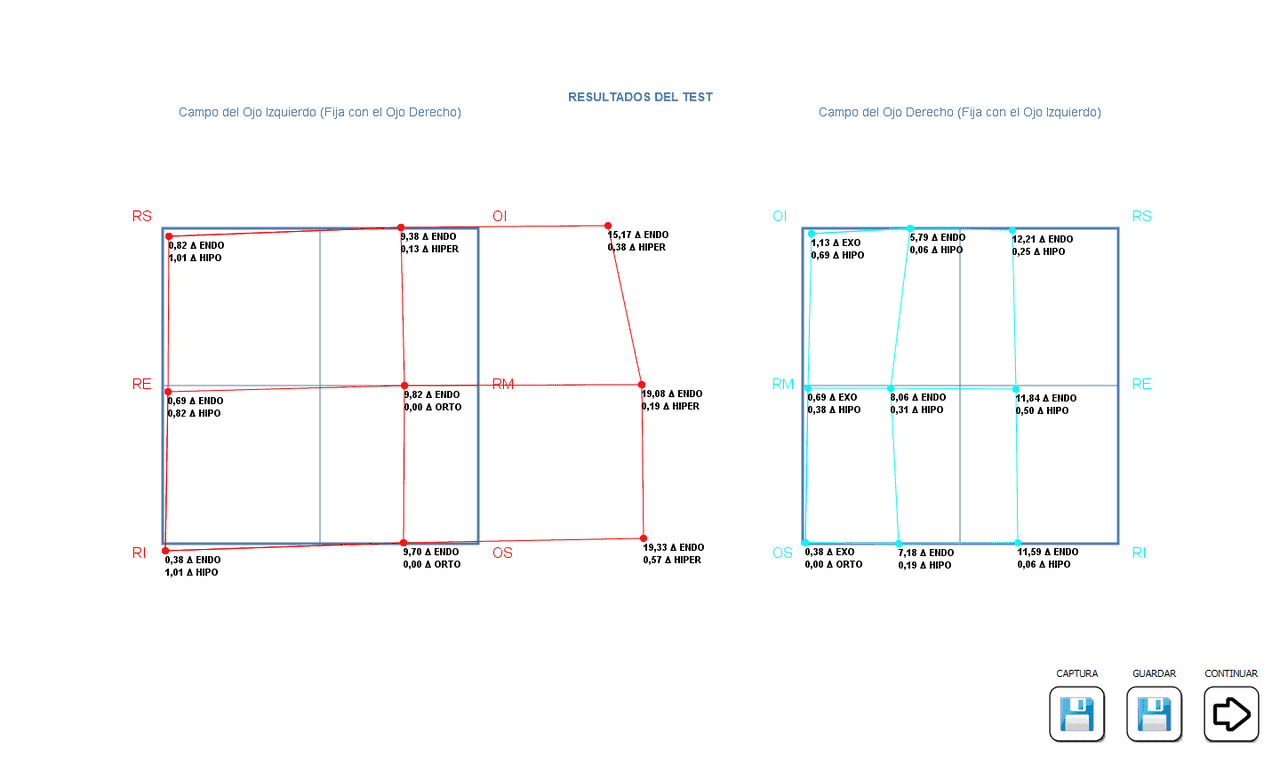
Now, we focus on the graph on the right, which corresponds to the motor field of the right eye. Since the RE has a paralysis of the external rectus, it cannot look to the right, and this is shown by the points being far from the vertices, with a marked deviation in Eso in the gazes to the right (top, centre, and bottom). This patient will have an esotropia in their right gaze.
If we now analyse the graph of the right motor field, we can see that it is much smaller than the background grid. Whenever we see this, we know that this is the eye with underaction in some muscle; it is the primary deviation, indicating underaction of the External Rectus muscle.
Now we look at the graph on the left, which evaluates the field of the LE, when we ask the patient to look to their right. Since the right eye cannot go to the right, the patient will send a lot of nerve impulse to try it, and by Hering’s law, the internal rectus of the left eye will receive an excess nerve impulse to look to the right, so the graph will be larger in that direction.
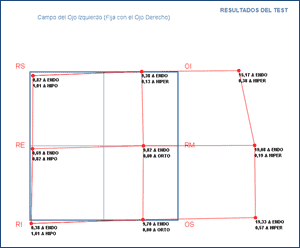
The graph of the left eye shows an overaction of the muscle that moves the eye to the right, in its effort to drag both eyes in that direction, and it is recorded that the points are very outside the grid, in the look to the right. This is the secondary deviation, indicating overaction of the Medial Rectus (or internal rectus) muscle in this example.
As we see, the smaller graph corresponds to the eye with some paralytic muscle (primary deviation), and the larger one to the secondary hyperfuncton in the other healthy eye. In recent paralyses, the difference between both graphs is very marked (as in this example), but over time, secondary contractures occur, and both graphs become more similar.
Taking into account the diagnostic position of each extraocular muscle and the degree of deviation from the graphs in the different gaze positions, it is possible to deduce which muscle is affected and what is its degree of overaction or underaction.
Saving the Results #
The program allows saving the numerical results and also saving the graph as an image.

For this, we can click on the blue export button, and the image will be downloaded to the computer’s “Downloads” folder.
Tool Menu Options #
Now let’s look at the rest of the test functions offered by the tools menu.
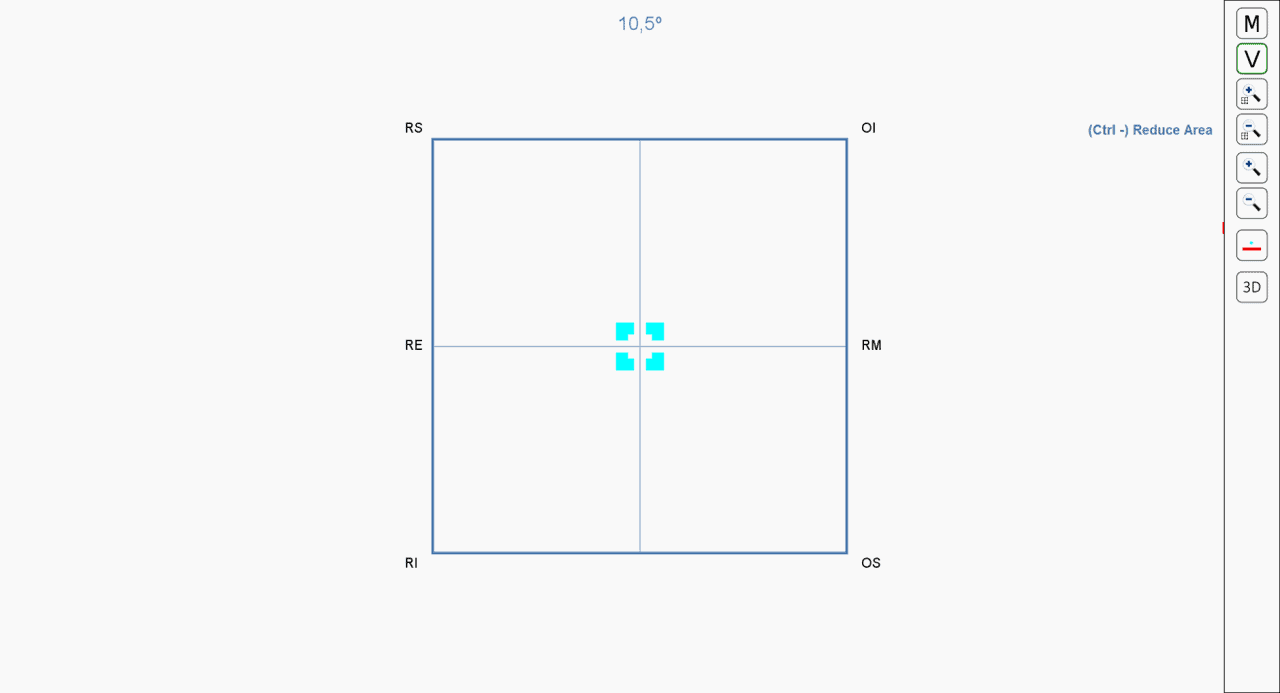
If we want to know which area to explore, we can click on the button with the letter “V” (or press the V key on the keyboard). A box then appears on the screen showing where the 9 diagnostic positions that the test will evaluate are located. The maximum angular distance from the fixation point is indicated in degrees above.
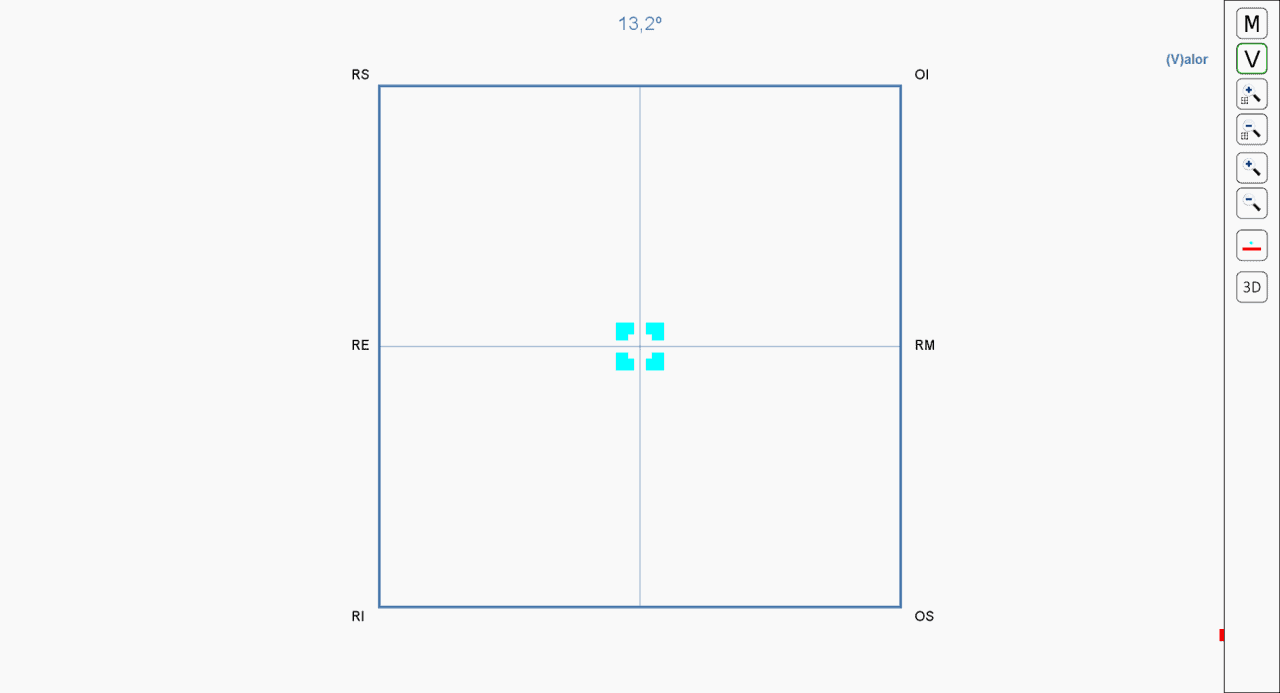
We can increase or decrease the size of that box with the increase and decrease icons from the tools menu (or by pressing with the key combination: “Ctrl Shift +” or “Ctrl Shift -”).
We can also increase or decrease the size of the cross and square, with the icons from the side menu; or by pressing the + and – keys.
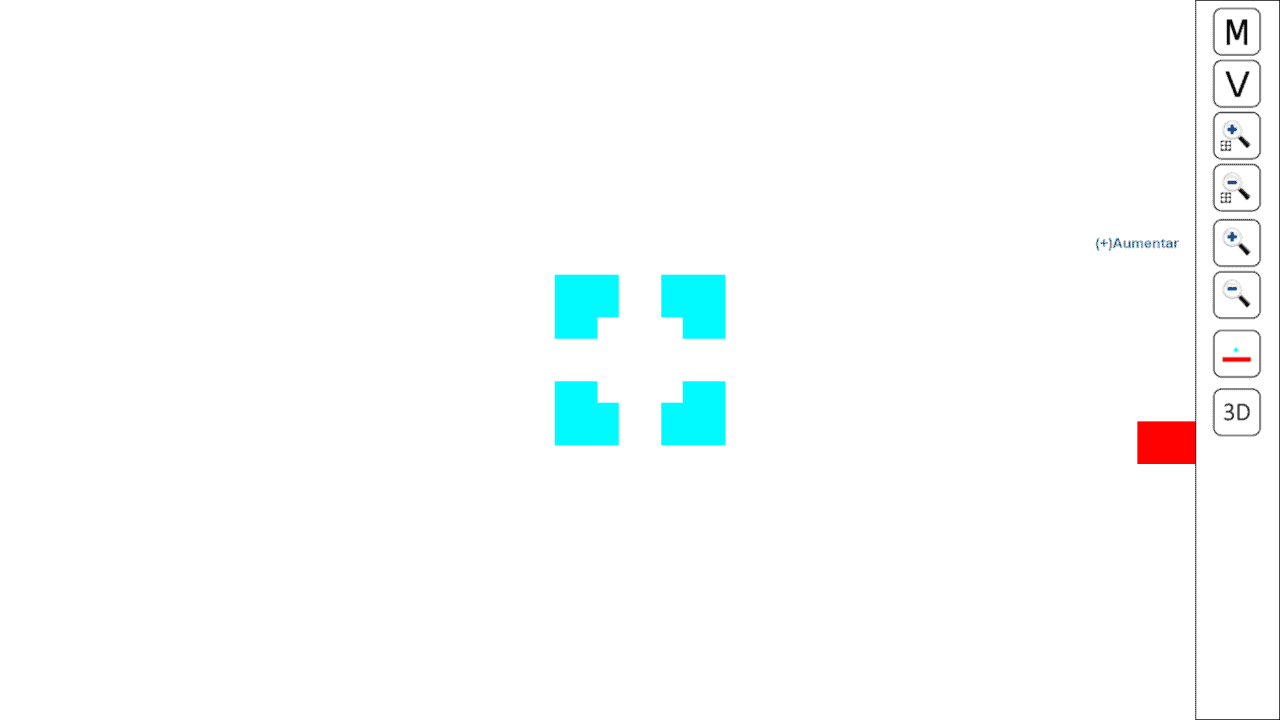
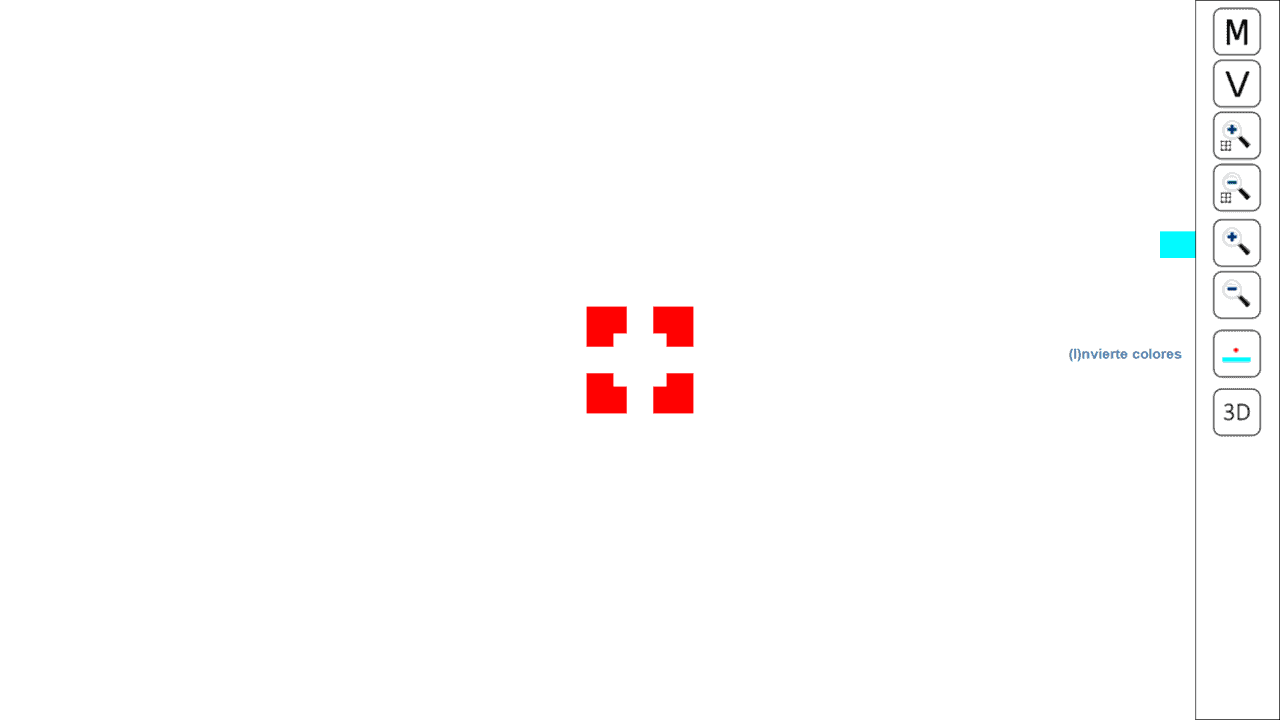
An icon is also included that allows reversing the colours to change which eye is fixing:
And a last button to switch to the polarized version of the test, in case we have a passive 3D screen.