Percentile curves were created by measuring Visual Acuity (VA) using specially designed VA charts. At Optonet, we have created similar optotypes but have included improvements in both design and measurement method to enhance the reliability of the test. Below, we explain how to measure VA in children using the Optonet Vision Unit to compare the obtained values with the percentile curves.
Material and Preparation #
Symmetrical Letters Charts #
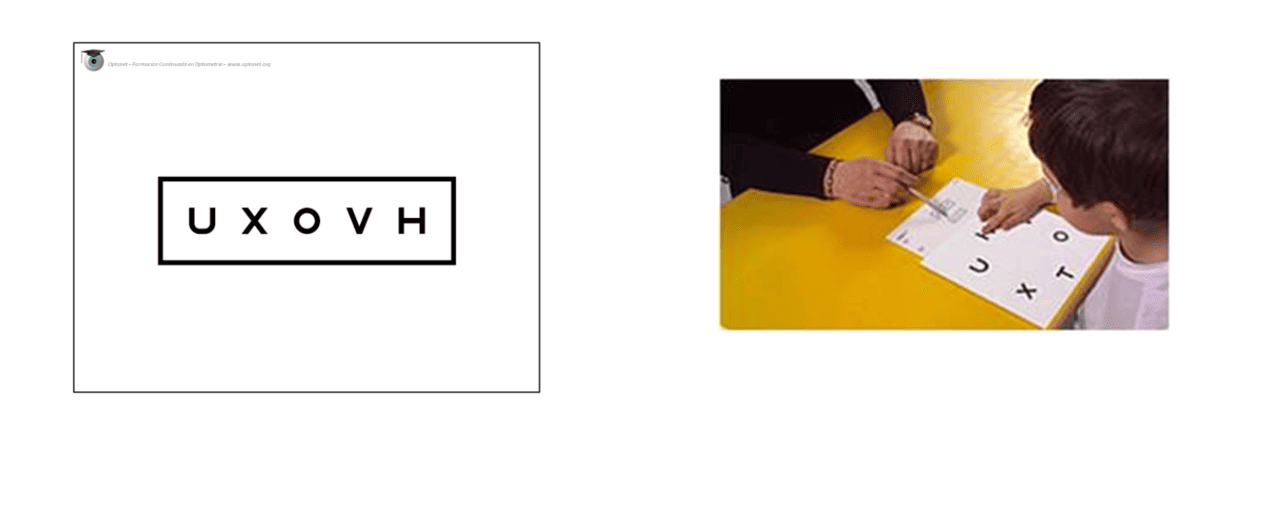
For exploring VA through Percentile Curves, we will use the paediatric chart of Symmetrical Letters. This optotype uses 6 symmetrical letters: X, T, U, O, H, V, which have similar difficulty levels.(1)
Matching Cards #
Many young children can identify some letters, even though they may not know how to name them. Also, some may feel intimidated in the clinic and may hesitate to vocalize their answers. To address this, we will use a card printed with these letters, where the child can point to the letter shown on the screen without needing to name it. This is known as a “Matching Card”.
Testing Cards #
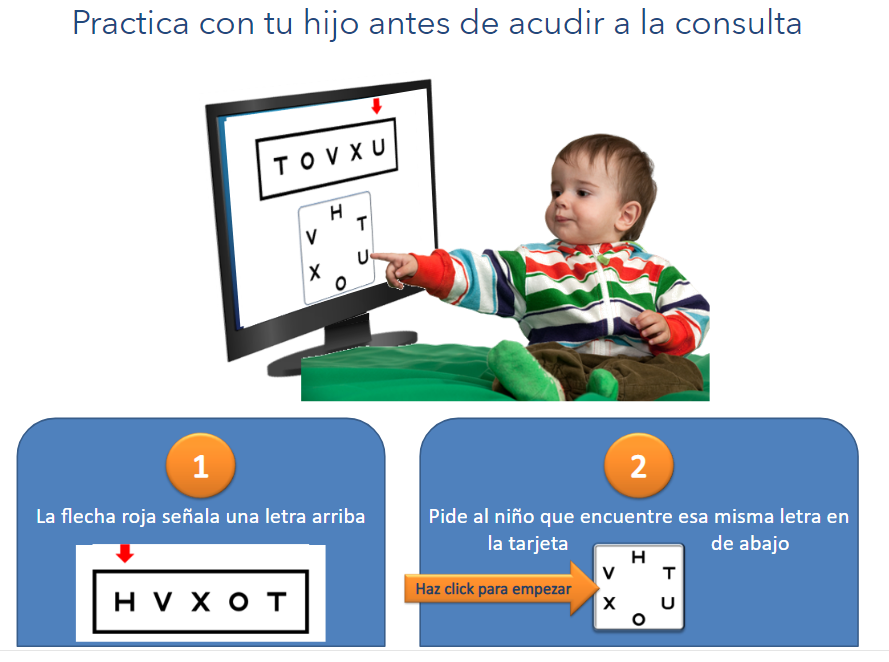
It’s beneficial for the child to practice pointing at the letters with their parents before the visual examination. For this, we can provide them with the Matching Card and printed Testing Cards. By playing a game of finding the same letter that mummy or daddy points to on the cards, the child will quickly learn the dynamics of the VA test. This learning can significantly improve the child’s cooperation in the clinic.
Another option is for the child to practice on a computer/tablet at home before coming, with the animation included on the website of the campaign “When I grow up, I want to see”: https://optonet.online/practice-visual-acuity/
Occluding Glasses (optional) #
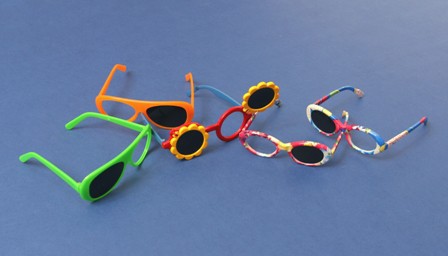
Experts agree that paediatric occlusion glasses are very helpful, as occluding one eye in a child is not always easy. There are various sizes and designs.
#
Calibration and Viewing Distance #
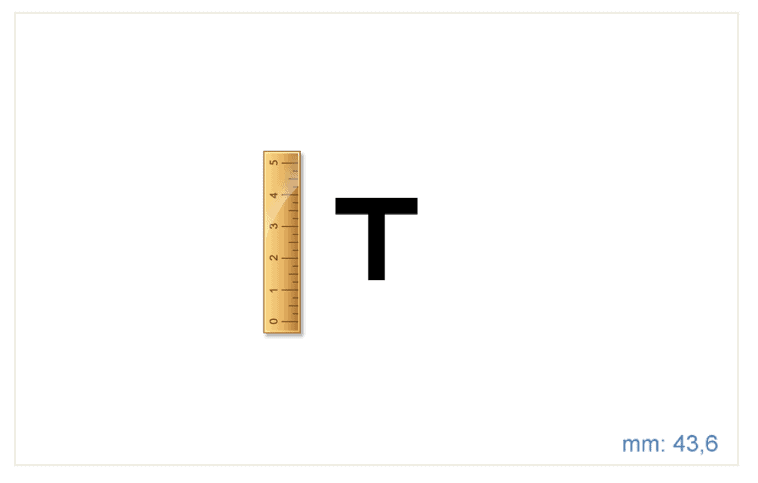
Before starting with the VA measurement, we must ensure that the Optonet Vision Unit is correctly calibrated. For this, we measure the distance between the observer’s eye and the screen (in millimetres). Then, we enter that distance in Setup → Screen, in the box for the viewing distance of children VA charts (Symmetric VA, Broken Glasses and Kay Pictures). The accuracy of this measurement greatly influences the VA values we obtain. A minimum separation of 3000 mm is recommended. An observation distance between 3 and 4 meters encourages cooperation from the youngest and least motivated patients. We can check the calibration of the VA charts at the following link:
https://optonet.online/va-charts-calibration/
Automatic Measurement Method #
We have incorporated an automatic method to measure VA in the Optonet Vision Unit to simplify the process and improve its reliability. Essentially, it involves asking the patient to read or guess the letters until they incorrectly say 4 or 5 letters of the same row.(2) We have incorporated this system to facilitate the measurement and avoid errors by the examiner. Thus, each time the patient reads the letters of a row, we count the number of correct answers and enter them (pressing the corresponding number on the keyboard, from 0 to 5). The program automatically advances, showing smaller and smaller letters, until we mark the number “1” (4 mistakes) or “0” (5 mistakes); then the measurement stops, and the program calculates the final VA value, which will be displayed on the screen.
Visual Acuity (VA) Measurement #
Remote Control #
For remote control of the charts, we can use a wireless keyboard or a Tablet as a Remote Controller. We will indicate the corresponding keys for each step.
Training and Verification of Responsiveness #
First, we sit the child and hand them the matching card, explaining that it has several letters. Then we show them another sheet from the “Testing Cards” with a single letter and ask if they have that same letter on their sheet (we can also use a Tablet to display the isolated letter). This way, we check if the child understands the test. Older children, if they prefer, can name the letters instead of pointing them out on their matching card.
The professional then moves away and shows another isolated letter, asking the child again to point it out on their matching card. Mom or dad can help us, indicating with a gesture if the child’s answer is correct.
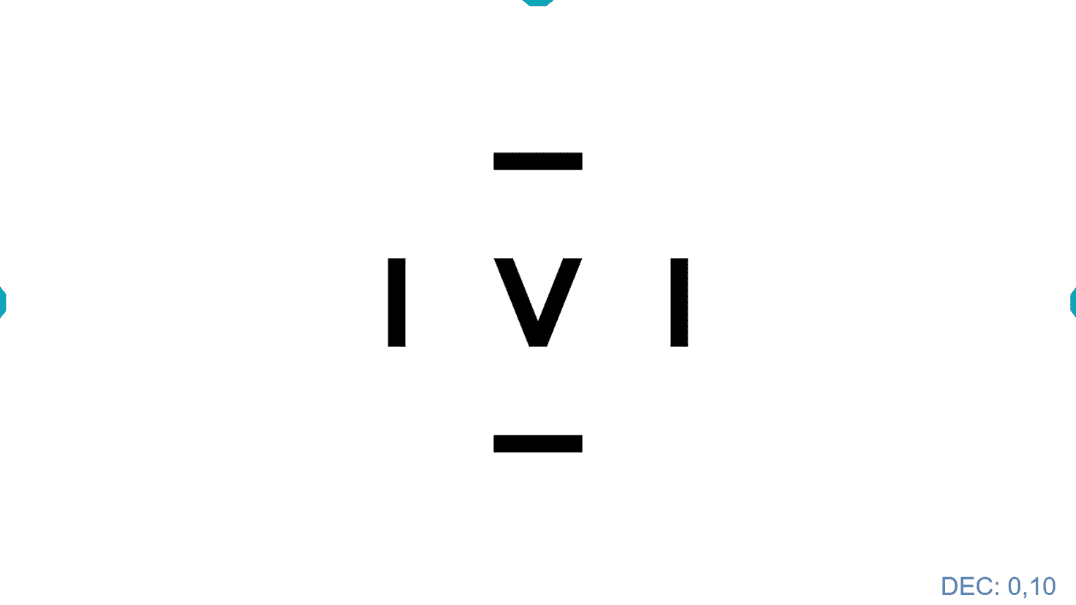
Now the professional moves away to the computer or Tablet screen (between 3 and 4 meters from the child) and, pointing to the letter displayed on the screen, asks the child again to find it on their card. The screen will display an isolated letter of a large size (for example, 0.10 Dec – 50 VAR). This is achieved from the tools menu, pressing the key “L” (or the arrow →), or on the tablet, with the button: ![]()

Measurement of Monocular VA (isolated rows with contour interaction) #
Once it’s verified that the child responds well, we introduce black lines around the letter to create contour interaction (pressing “C” on the keyboard or the button ![]() on the Tablet), and we begin the measurement of monocular VA. Interaction is used because it increases the sensitivity of the test for detecting amblyopia.
on the Tablet), and we begin the measurement of monocular VA. Interaction is used because it increases the sensitivity of the test for detecting amblyopia.
To change the size of the letters, we can use the buttons ![]() on the tablet or the “up ↑ and down ↓” arrows (or the “+” and “-”) keys on the keyboard.
on the tablet or the “up ↑ and down ↓” arrows (or the “+” and “-”) keys on the keyboard.
Then, we place the occluding glasses on the child (or one of the parents occludes the child’s eye) and proceed to measure the monocular VA, first in the RE and then in the LE.
We start with a large letter, for example, 50 VAR (6/60, 20/200, 1.0 Log, 0,1 Dec), and if it’s identified correctly, we will display increasingly smaller letters until the patient makes a mistake.
Then we go up one VA level (to the last letter seen) with the “↑” arrow or the “+” key, or the buttons: ![]() . Now we display an isolated row of letters with contour interaction of that size, pressing the “R” (or “Enter”) key or the button:
. Now we display an isolated row of letters with contour interaction of that size, pressing the “R” (or “Enter”) key or the button: ![]()
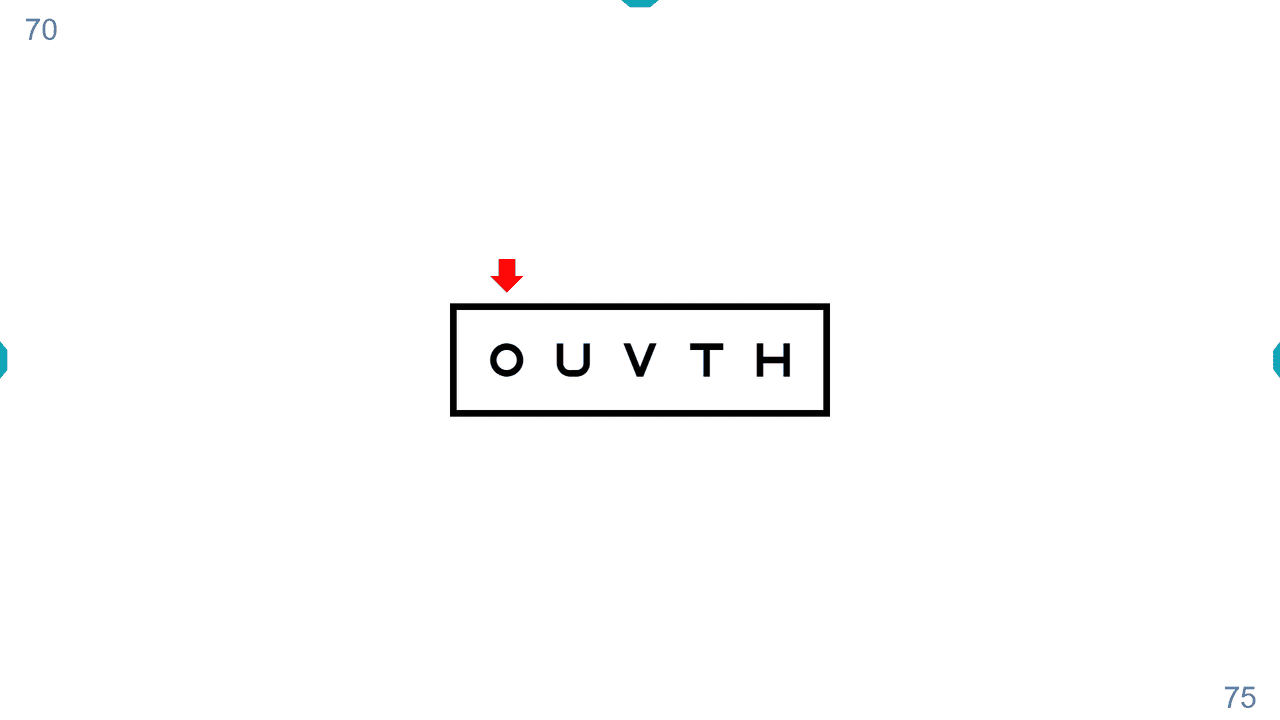
For instance, if the isolated letter that was failed was 75 VAR, we go to the previous size of 70 VAR to display a row with contour interaction.

Then we point out the letters, one by one, with the red arrow (using the right “→” and left “←” keys) or the buttons: ![]() and finally press the number of correct answers
and finally press the number of correct answers ![]() . We expect a maximum of one mistake in this first row (5 or 4 correct answers). If more than one letter is failed, instead of entering the number of correct answers, we will increase the size of the row and try again, to start the measurement in a row where at least 4 correct answers are achieved.
. We expect a maximum of one mistake in this first row (5 or 4 correct answers). If more than one letter is failed, instead of entering the number of correct answers, we will increase the size of the row and try again, to start the measurement in a row where at least 4 correct answers are achieved.

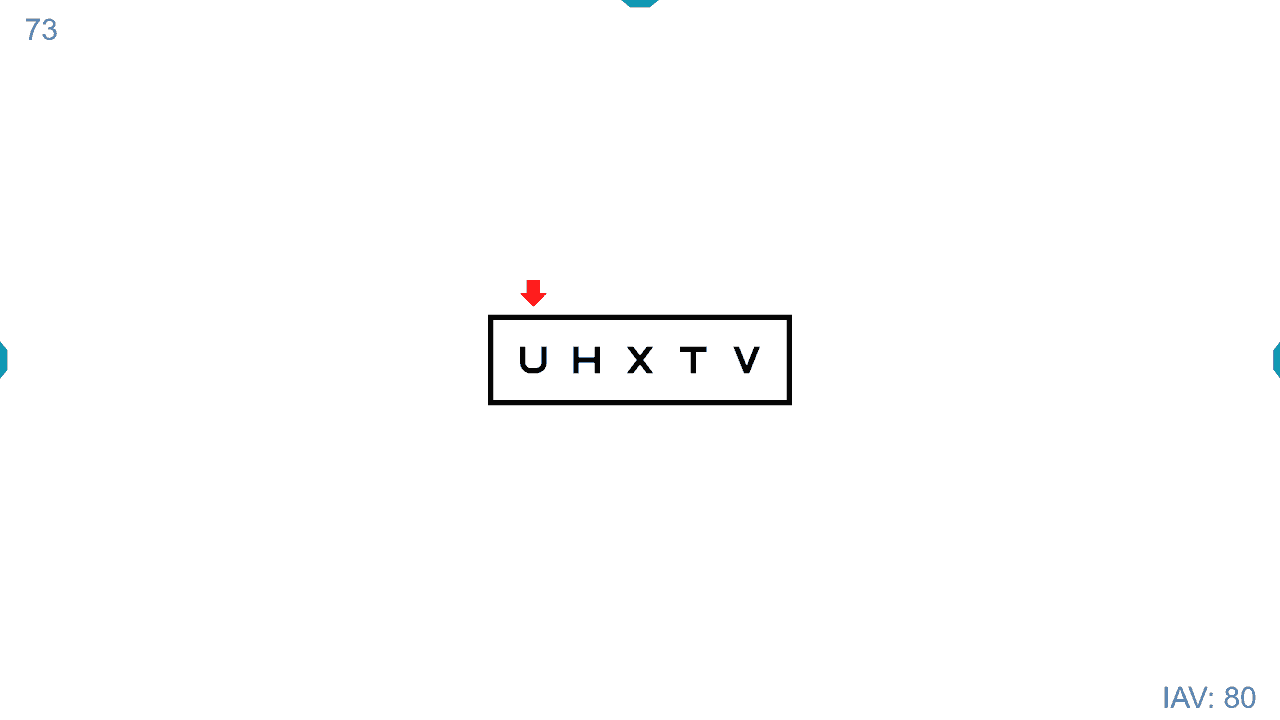
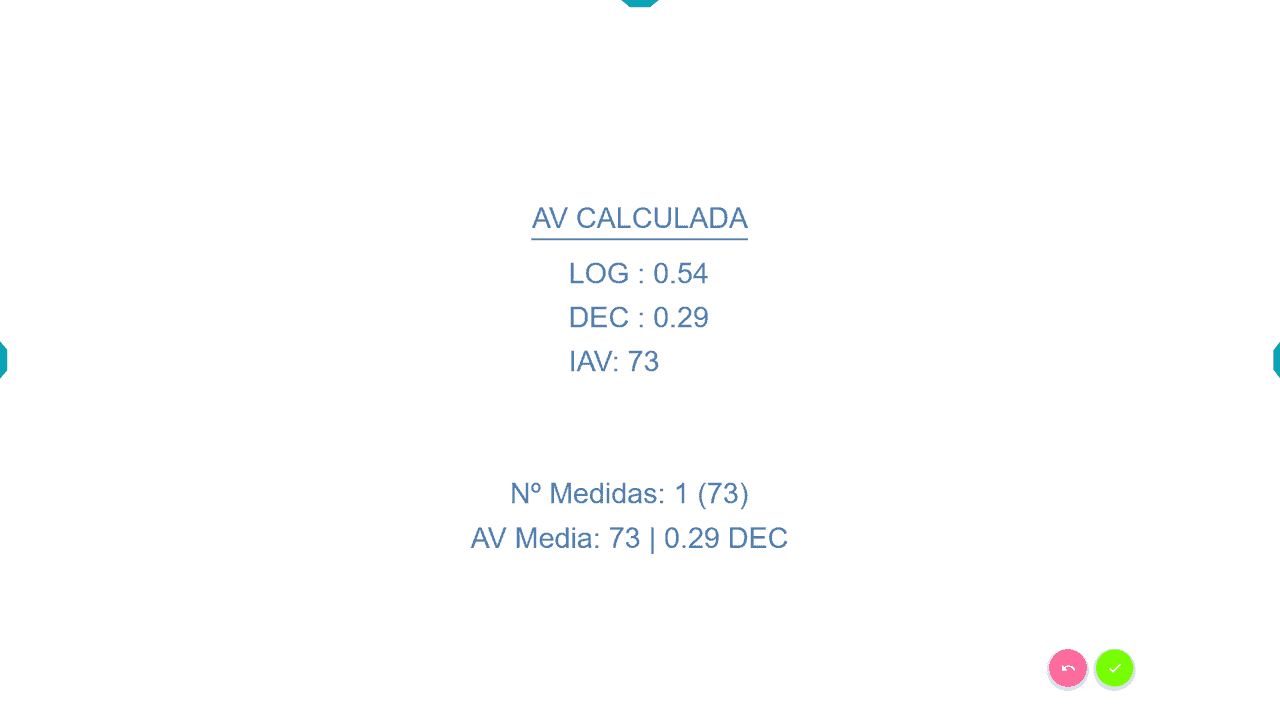
This way, we start the automatic count (e.g., pressing the number “5”), and the program will then display the next step of VA: 75 VAR. The VA value of the letters on the screen is indicated in the lower right corner, while the accumulating VA value of the patient is displayed in the upper left corner.
The child identifies the letters again, and we press the keyboard on the number of correct answers. Let’s assume the patient is only able to get 3 letters right from the 75 VAR line; then we press the “3” key, and the next row will appear on the screen, of size 80 VAR. So far, the child’s VA is 70 + 3 = 73, (as shown in the upper left corner) because the patient identified all the letters of the 70 VAR row, plus 3 from the 75 VAR row.
Let’s now imagine that in the new row of 80 VAR, the patient fails all the letters, and we press the number “0”. We have reached the end, so the program will display the VA Calculated with the automatic method, expressed in five units: Log, VAR, Dec, Snellen (m) and Snellen (ft).
We save the result in the patient record; either by hand or by pressing the button for automatic saving: ![]()
Then we ask the parent to now cover the other eye (the right one) and press the “Esc” key, or the button ![]() to return to the initial row of letters with contour interaction. We press the “Z” key, or the button
to return to the initial row of letters with contour interaction. We press the “Z” key, or the button ![]() to change the letters (preventing memorization). And finally, we press the right or left arrows to point out the letters again.
to change the letters (preventing memorization). And finally, we press the right or left arrows to point out the letters again.
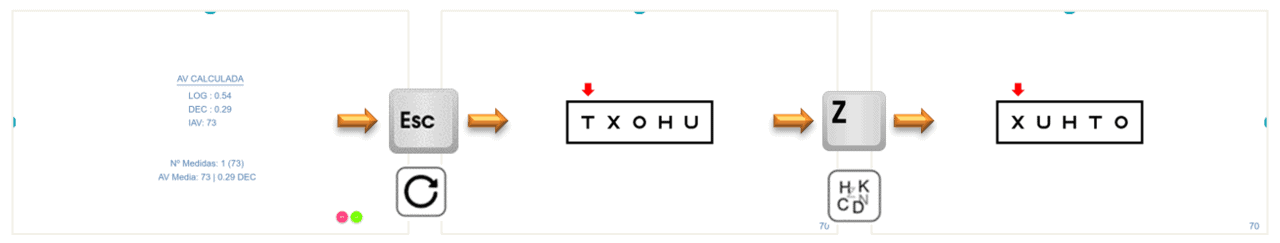
We follow the same process of automatic measurement, pressing the number of correct answers, until the measurement is completed. If the vision is worse with this eye, we will start with a larger row of letters. We save the result of the left eye.
Repeated Measurements #
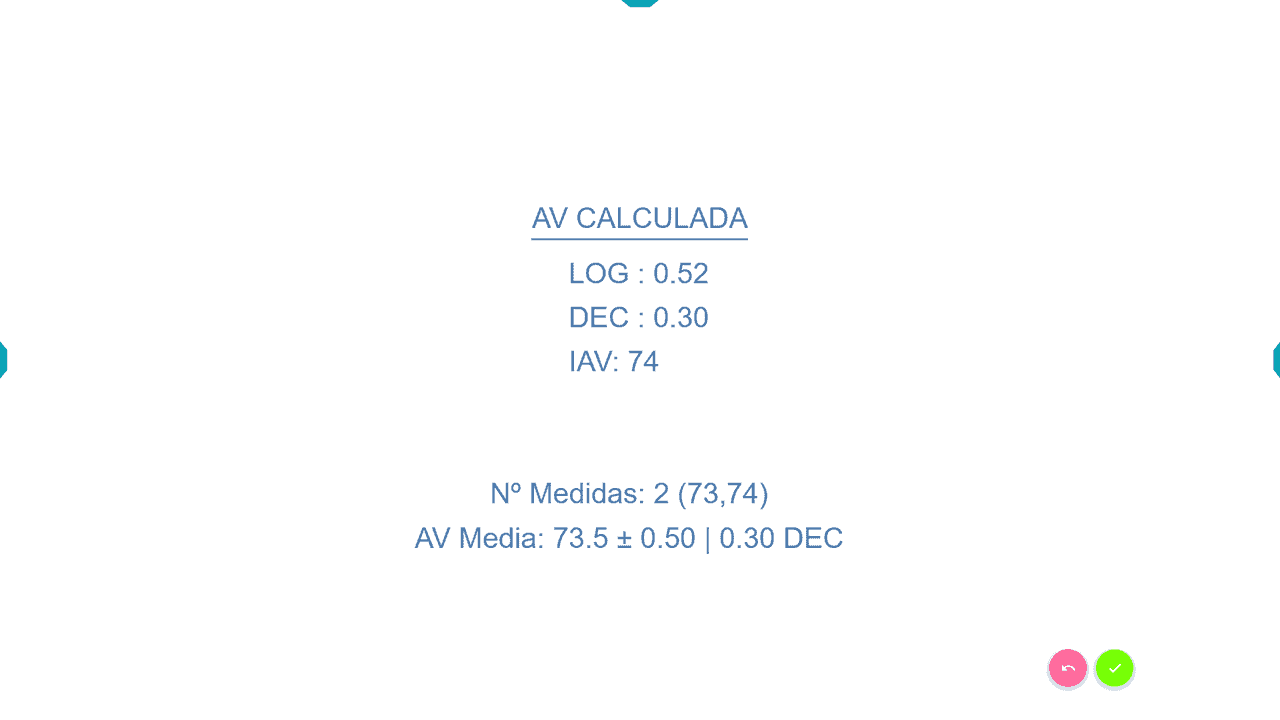
In cooperative children, we can increase the reliability of the test by taking two measurements per eye (the program calculates their average). This is very useful if the VA is reduced, as we ensure that the value is more accurate.
How to repeat a measurement: at the end of the measurement, when the results appear on the screen, we press “Enter” or the button ![]() /
/![]() to repeat the process. In the end, the unit offers the average value of the measurements, also indicating the number of measurements and the standard deviation.
to repeat the process. In the end, the unit offers the average value of the measurements, also indicating the number of measurements and the standard deviation.
At all times, we will ask the child to try to guess the letters, even if they fail, avoiding settling for saying that they can’t see a letter. Often, children want to stop when they are not entirely sure, so they could give lower VA values than they actually have.
VA Percentile Curves #
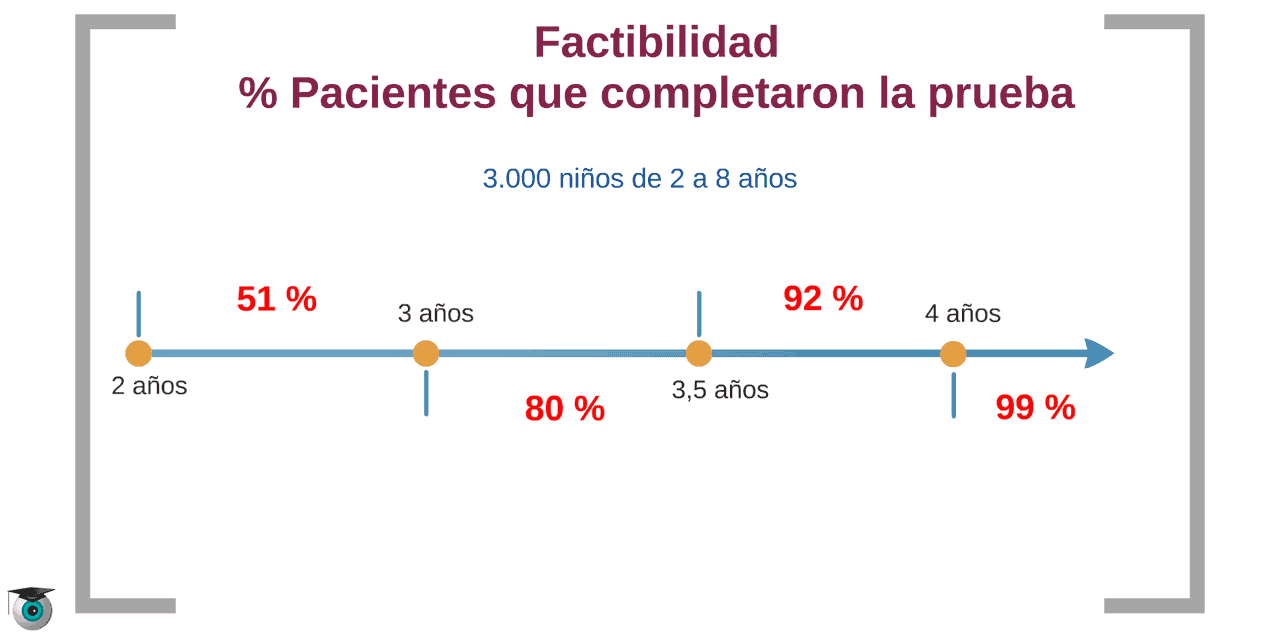
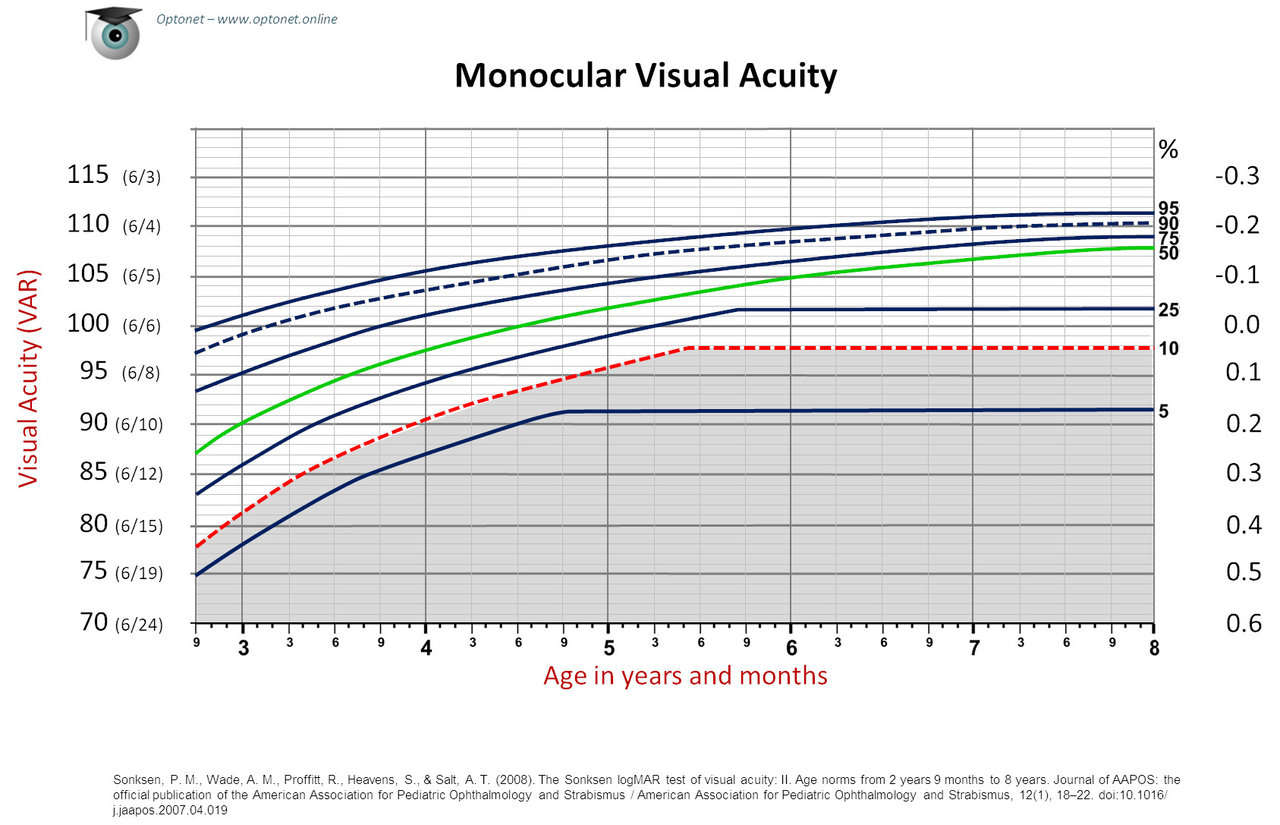
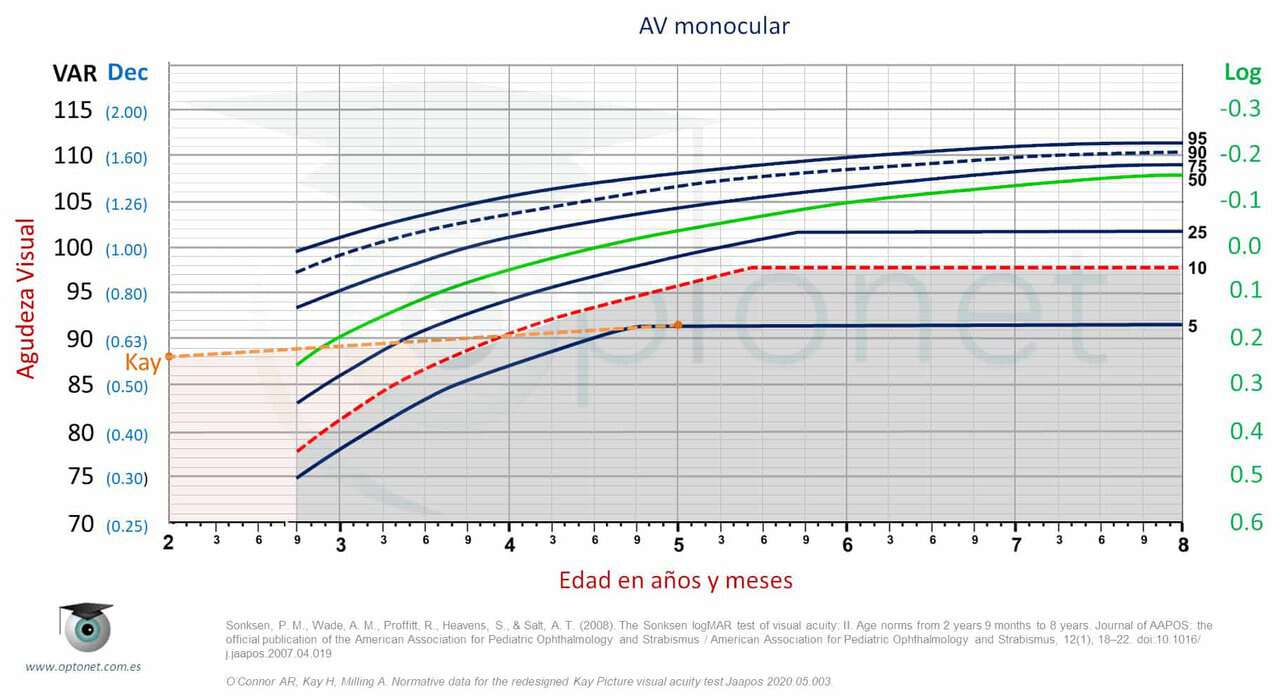
These VA percentile curves come from a study conducted in 2008, in which VA (with symmetrical letters in isolated rows with contour interaction, similar to those included in the Optonet Vision Unit) was measured in a population of about 3,000 children, from 2 years and 9 months to 8 years old. (3),(4),(5) All children who understood the test were included, regardless of whether they presented vision disorders, and VA was always taken without refractive correction. This way, reference data were collected from the entire child population between 2 years and 9 months and 8 years old.
Description of the VA Percentile Curve #
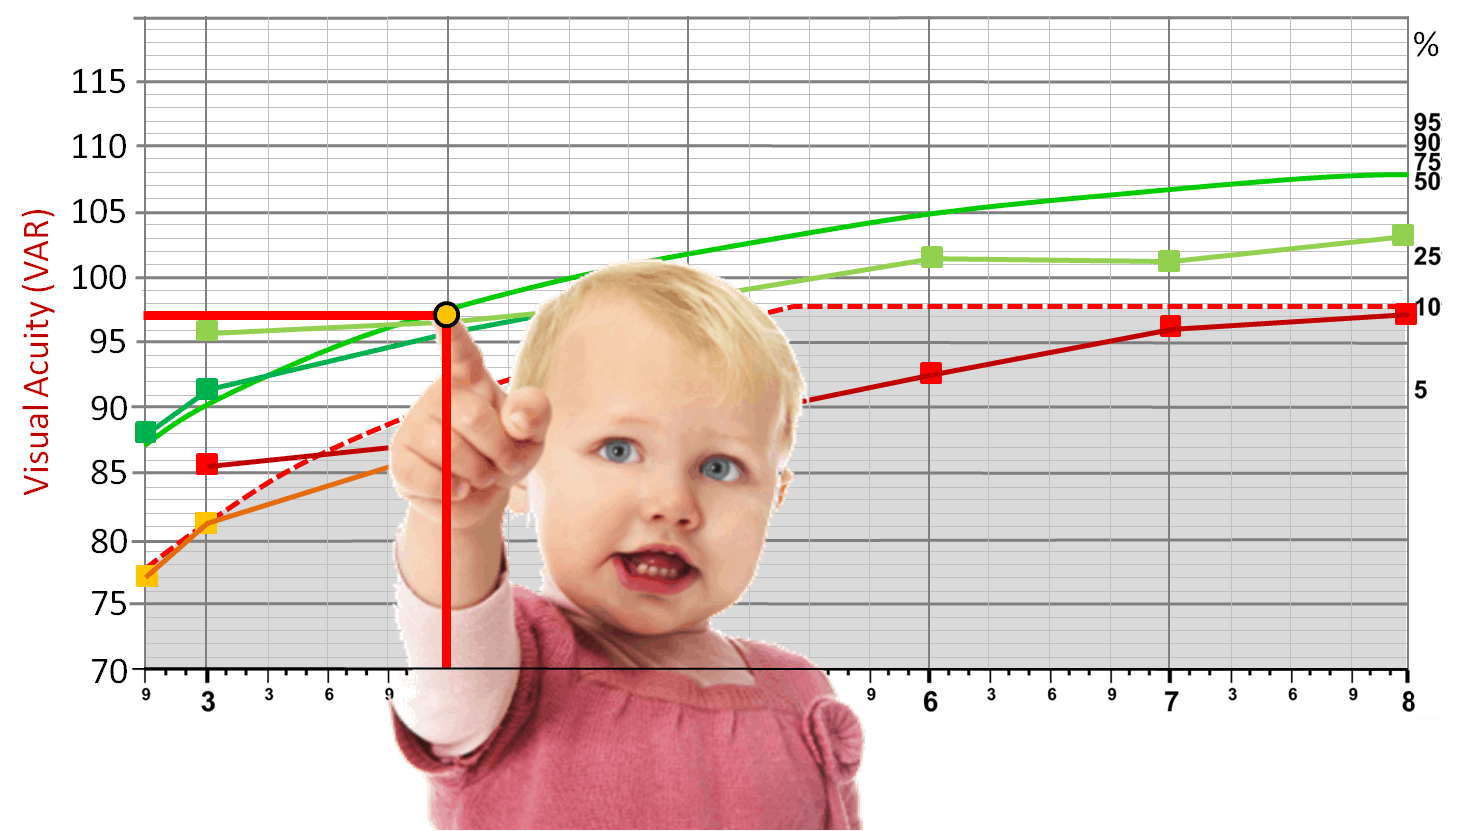
The percentile graphs indicate the child’s age on the horizontal axis (in years and months), and the VA in VAR notation on the vertical axis.(6) Seven curves are displayed, each with a number to the right, indicating its corresponding percentile: 5, 10, 25, 50, 75, 90, and 95. These numbers indicate the percentage of children who have a VA equal to or worse than the values of the curve. For example, the central green curve represents the 50th percentile: half of the children have better VA and the other half equal or worse. The gray shaded area is delimited by the red curve corresponding to 10%, so a VA equal to or worse than this curve is only presented by 10% of the children.
Comparison of the Patient’s VA #
These curves allow us to compare the VA of a specific child with the rest of the children of the same age. To know in which percentile the child is, first, we look down for their age, and then we locate their VA value to the left. We follow both coordinates until they intersect on the graph, and we mark the point where they cross.
For example, in the following graph, the VA value of 100 VA in a child of 5 years and 3 months of age is shown (yellow point).
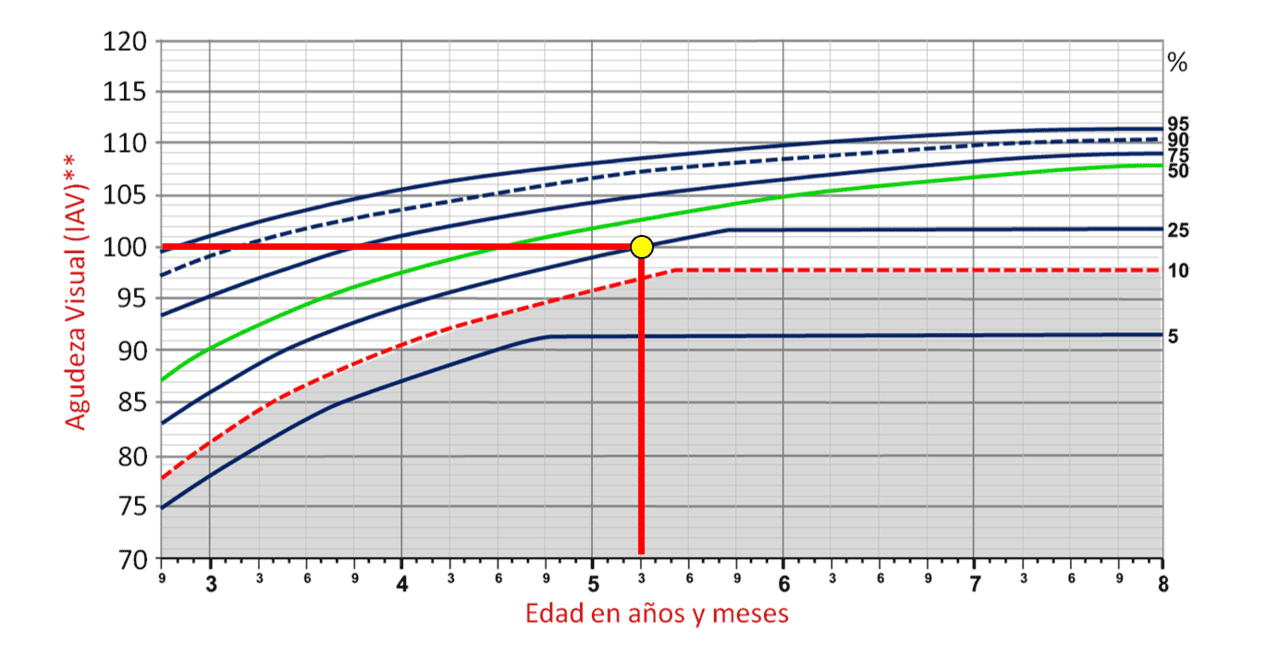
We see that our point falls just on a curve, and if we follow it to the right, we verify that it corresponds to the 25th percentile. This means that 25% of children of 5 years and 3 months have worse vision (or the same, that 75% of children that age have equal or better VA).
Here we see another example of a child who reaches the same VA of 100 VA (1.0 Dec) but at 4 years and 6 months of age.
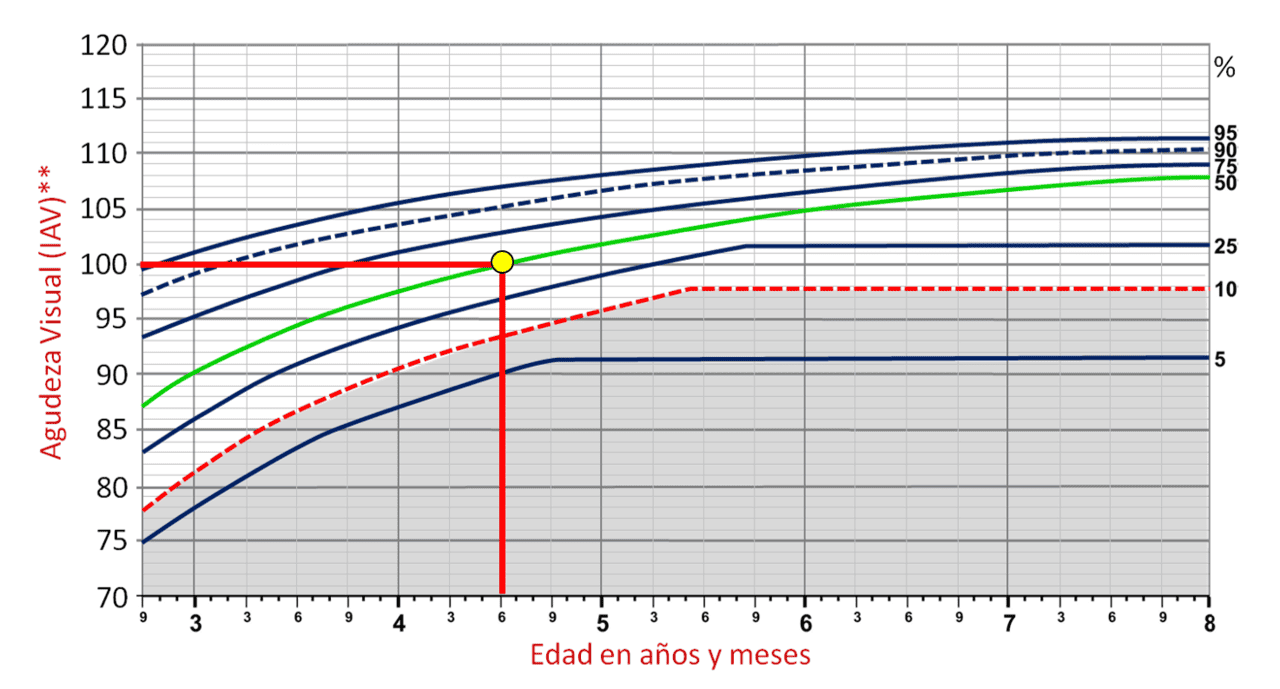
This new point now falls on the green curve corresponding to the 50th percentile, placing it in the centre of the spectrum. Here we can appreciate an interesting finding of the percentile curves: 50% of children reach a VA of 100 VAR (6/6 and 20/20 Snellen, 1.0 Decimal) at the age of 4 years and 6 months.
When to Suspect a Visual Problem? #
The higher the point on the graph, the better the child’s vision compared to other children their age. Conversely, if a child’s VA falls very low, below the 10% line (the gray shaded area), it means they see worse than 90% of the children of that age.
Children with vision disorders (significant refractive error, amblyopia, or ocular pathology) will almost all be in this lower part of the graph. Whenever a child’s VA falls in the shaded area (the 10% with the worst VA), it is advisable to perform a complete visual examination in search of a possible vision disorder. The 10% margin was established by the authors of the curves,(3),(4), but it is possible that future studies suggest another level of VA to raise the alarm. Below is an example of a patient in the gray area:
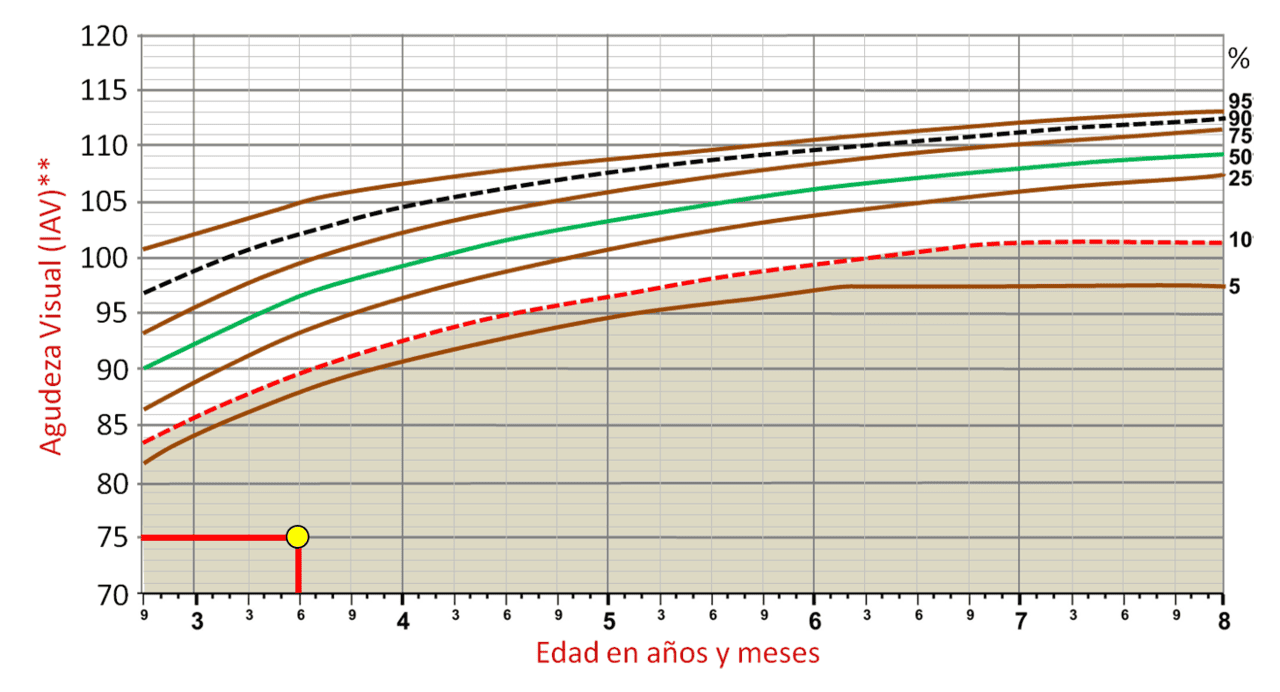
If a child is below the 10th percentile, it does not always mean that they have a vision problem, but it is necessary to perform a complete eye examination to rule out that possibility.
In total, we can perform three graphs per child: monocular VA in the RE, monocular in the LE, and binocular. In all of them, we will use isolated rows of letters with contour interaction.
Inter-ocular Differences #
In the Percentile Curves study(3),(4), it was also established that only 10% of the children had AV differences between the two eyes greater than 6 VAR units (i.e., in 90% of the children, the VA differences between one eye and the other are less than 6 letters of the VA chart). This is very interesting because if we find a difference of 6 or more letters between the VA of each eye, it is advisable to perform a complete visual examination on that child. The study results showed that VA differences between both eyes did not depend on age.
Follow-up: How Often Should the Child Be Seen? #
Each child’s growth has its own pace, and therefore percentile curves are ideal for assessing how they are developing compared to other children their age. Therefore, we will recommend to parents that they visit with their children periodically to assess how their vision is maturing.
The curves indicate that until 5 years old, there is a much more rapid improvement of VA than after, up to 8 years. Therefore, from 2.5 or 3 years old, it would be advisable to see the child every 6 months (or 3 months if they have low VA). Then, from 5 years old, the VA changes more slowly, so we could space the appointments to 12 months, especially if there is acceptable VA. We can keep a copy of the curves on the computer (or on paper) and give another copy to the parents, so they can keep track, and even show it to the paediatrician.
In the following graph, we show an example of VA follow-up on a child over several years. Each point indicates the VA presented at each review.
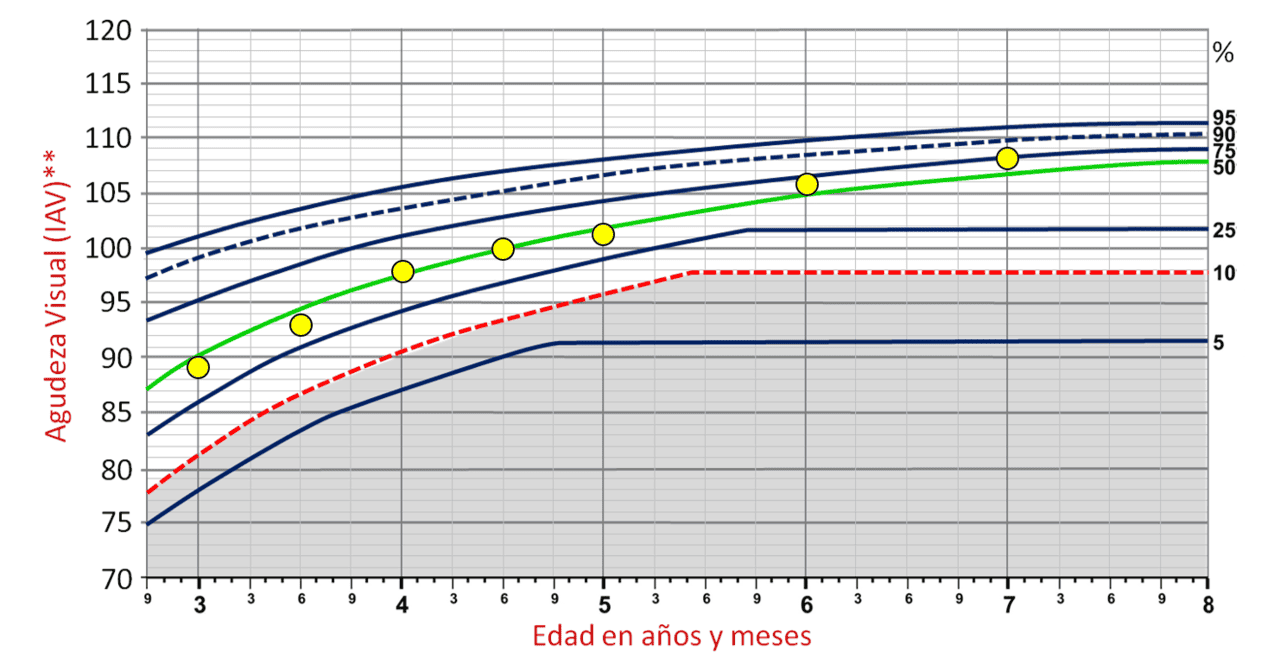
We can explain to parents that what is important is not being in a high percentile, but rather developing vision more or less steadily. Ideally, they should reach a visual acuity above 100 VAR (more than 6/6, 20/20, 1.0 Dec) from 5 years old.
Note: Before concluding, it should be noticed that all these VA reference values are only applicable if we measure the VA with the appropriate charts (such as those included in the Optonet Vision Unit). These values are not extrapolable to other VA optotypes or other measurement conditions.
Download Material for Percentile Curves #
Below, you can download the necessary materials for the percentile curves:
Percentile Curves and “Kay” Pictures
References #
1. Bennett, A. G. Ophthalmic test types. A review of previous work and discussions on some controversial questions. Br. J. Physiol. Opt. 22, 238–71 (1965).
2. Carkeet, A. Modeling logMAR Visual Acuity Scores: Effects of Termination Rules and Alternative. 78, 529–538 (2001).
3. Sonksen, P. M., Wade, A. M., Proffitt, R., Heavens, S. & Salt, A. T. The Sonksen logMAR test of visual acuity: II. Age norms from 2 years 9 months to 8 years. J. AAPOS Off. Publ. Am. Assoc. Pediatr. Ophthalmol. Strabismus Am. Assoc. Pediatr. Ophthalmol. Strabismus 12, 18–22 (2008).
4. Salt, A. T., Wade, A. M., Proffitt, R., Heavens, S. & Sonksen, P. M. The Sonksen logMAR Test of Visual Acuity: I. Testability and reliability. J. AAPOS Off. Publ. Am. Assoc. Pediatr. Ophthalmol. Strabismus Am. Assoc. Pediatr. Ophthalmol. Strabismus 11, 589–96 (2007).
5. Norgett, Y. & Siderov, J. Crowding in Children’s Visual Acuity Tests — Effect of Test Design and Age. 88, 920–927 (2011).
6. Bailey, I. L. & Lovie-Kitchin, J. E. Visual acuity testing. From the laboratory to the clinic. Vision Res. (2013). doi:10.1016/j.visres.2013.05.004