Continuing with the section dedicated to stereopsis tests, which includes two different stereo acuity charts.

Bars chart #
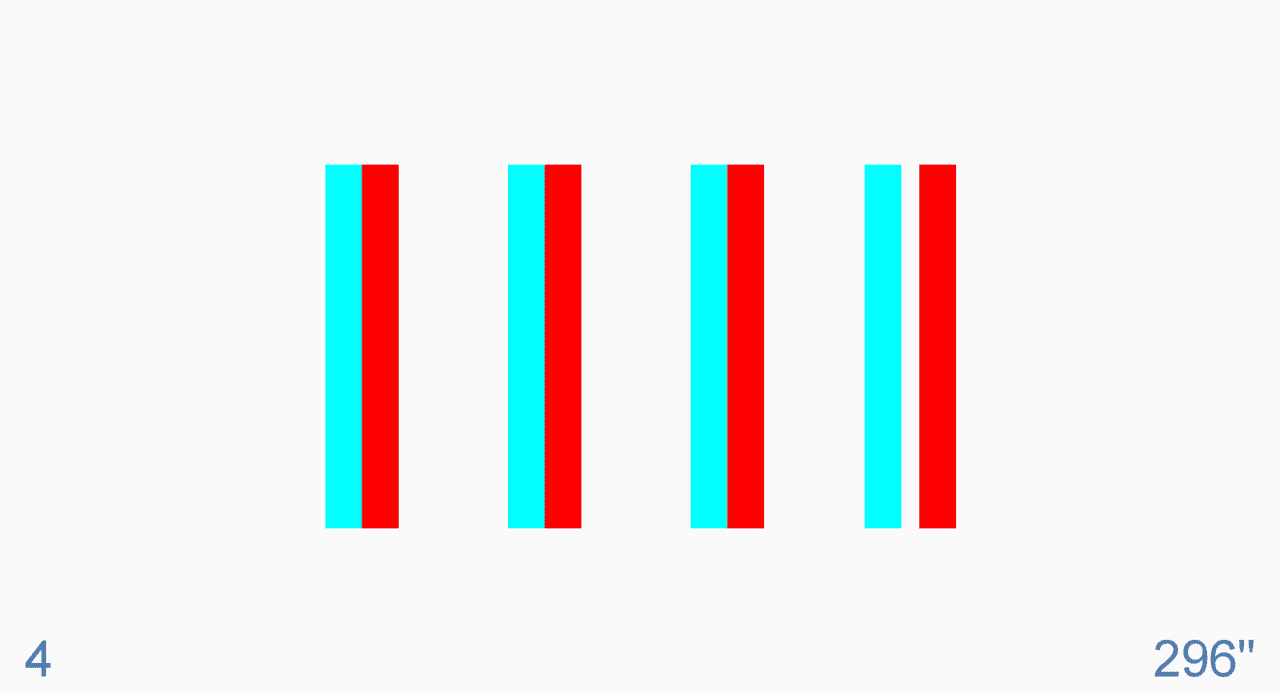
The first stereopsis test evaluates local stereo acuity through a set of four vertical bars. When viewed through red/blue glasses—with the red filter consistently placed in front of the right eye—these bars, if perceived in stereopsis, seem to float slightly off the screen. The task for the patient is to identify which of the four bars protrudes the most, meaning which appears to rise above the others and seems nearest to the patient.

The range of stereo acuity varies depending on the resolution and size of the screen used and the viewing distance. Typical values for a 23-inch screen at 5 meters distance range from about 1000″ to 10″ (seconds of arc).
To know the value of stereo acuity, we need to click on the corresponding icon from the tool menu, or press the “S” key [(S)tereopsis] on the keyboard. By pressing either, the value of stereo acuity in seconds of arc for the chosen distance will be displayed in the lower right corner.
In the lower left corner will also appear a number from 1 to 4, indicating which is the most protruding bar, from the first to the fourth (i.e., the response that the patient has to give), so the professional knows the correct answer. Pressing again will hide these values to not interfere with the test execution.

The most protruding bar is the fourth, with a stereo acuity of 296”
At any moment, it’s possible to change the most protruding bar by clicking on the “Random” icon (from the tool menu) or pressing the “Z” key on the keyboard.
When starting the test, the patient will observe 4 bars with stereo acuity around 300” (seconds of arc). We can change the stereo acuity in large or small steps, for which we have buttons in the tool menu. By pressing the double arrow icons, we advance in steps of double or half the stereo acuity, so in a few steps, we reach very fine stereopsis. These changes can also be made using the up ↑ and down ↓ arrows on the keyboard.
For minute adjustments in stereo acuity (as permitted by the screen’s resolution), single arrow icons or the right (→) and left (←) arrow keys on the keyboard can be employed.
When starting the test, it’s recommended to use the double/half functions to quickly find a value close to the stereo acuity threshold, and then make finer changes, making slight changes in stereopsis.
The size of the bars’ height is equivalent to a letter of 1.30 log VA (0.05 Dec), their thickness to 0.3 log (0.5 Dec), and the separation between bars is 4 times the thickness of a line. It’s possible to increase the size of these bars (in steps of 0.1 log) using the corresponding icons from the tool menu, or by pressing the “+” and “-” keys on the keyboard.
Remote Control via Tablet (Android or iPad) #
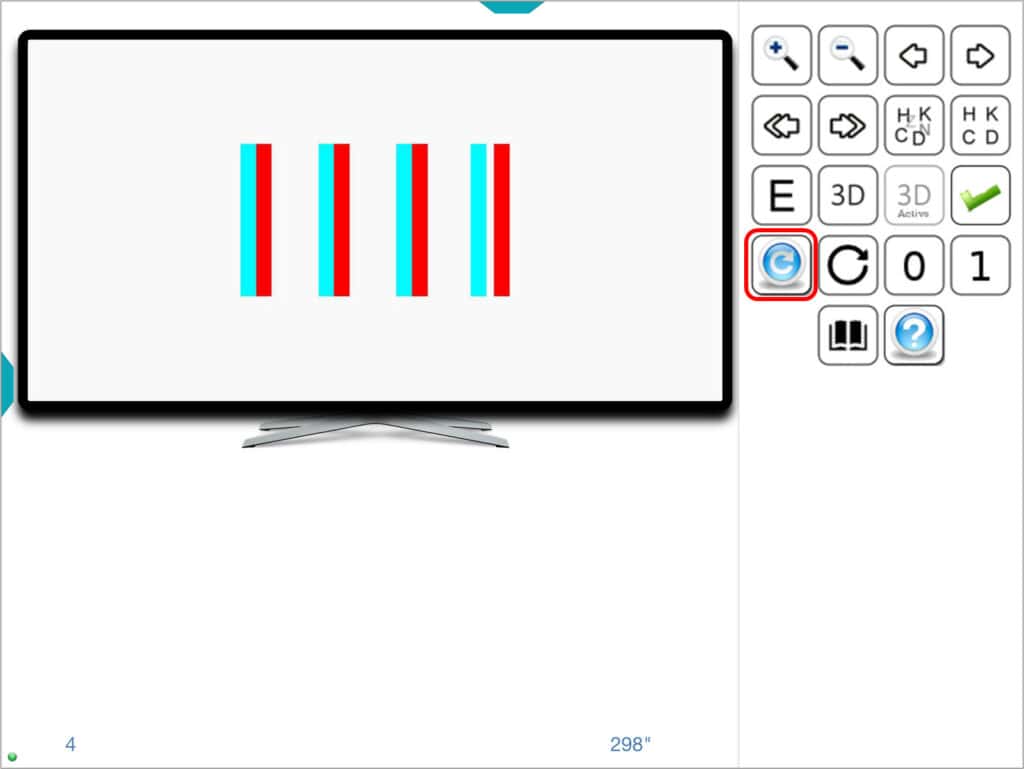
The following image displays the alternative tool menu for remotely controlling the stereo acuity Bar chart via an Android tablet or iPad:

The tablet screen includes all the tool menu icons and also displays the updated value of stereo acuity (300” in our example) and the correct answer (bar number 2), without having to show them on the remote screen of the Vision Unit.
This setup ensures the professional can view on the tablet screen everything the patient sees on the vision unit without needing to turn and look at the distant screen.
Random Dots Chart #
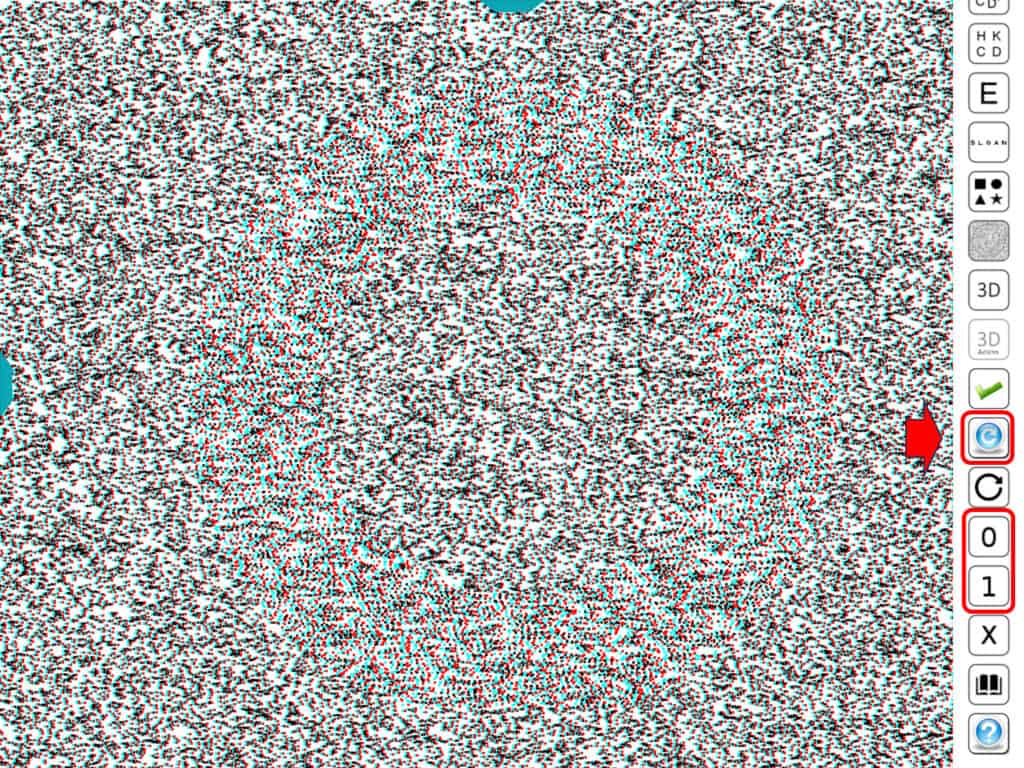
A second stereo acuity chart is included to assess global stereopsis, featuring a background of randomly arranged dots aimed at eliminating monocular cues.

The test is conducted again using colour filters, placing the red one in front of the right eye as usual. Observing with one eye at a time, a pattern of random dots is seen. If the patient has good binocular vision, with both eyes they will be able to observe a letter that stands out from the background. This chart does not have monocular cues through the glasses, so it is not possible to identify the “hidden” letter through the filters if it is not seen in stereopsis.
By default, the test uses 6 symmetrical letters:
X, T, U, O, H, V
whose difficulty is statistically similar, although it is possible to change the type of letters to Sloan:
C, D, H, K, N, O, R, S, V, and Z
To know the correct answer and the stereo acuity value, we can press the corresponding icon on the right tool menu (or the “S” key on the keyboard). The letter “hidden” on the screen is shown in the lower-left corner, while the stereo acuity value, in seconds of arc, is displayed on the right. The size of the letter in VA values is indicated in the centre.
For example, in the following image with the filters, an “O” will be observed that corresponds to a stereo acuity of 296” and has a size of 0.032 Dec (1.5 log):

To know in which notation the VA is expressed, simply hover the mouse over that number, and the notation of measure will appear. In the image above, the VA is indicated in Decimal notation (Dec). To change the type of notation, we will repeatedly click on the numeric value of VA or on the “W” key. The sequence of changes in VA notation is: Decimal, Snellen (in feet, which is the common notation in the United States), Snellen (in meters, common in the United Kingdom), millimetres* (the height that these letters need to measure on the screen to actually correspond to the indicated VA), “M” notation, logarithmic (log), and finally VAR notation.
As usual, the test has a pair of zoom buttons to modify the size of the letters displayed in stereopsis in 0.1 log steps (we can also use the “+” and “-” keys). The size chosen in the last execution of the program will be saved automatically for the next session. It is recommended to use a VA of at least 0.04 Dec.

In the tool menu, we have buttons for large changes in stereo acuity or for very slight changes, just like in the previous stereo acuity Bars chart. We can also make these changes with shortcut keys: vertical arrows for marked changes and horizontal arrows for small changes in stereo acuity.
Each time we vary the stereo acuity value, a different letter is displayed on the screen; but within the same value, we can also randomly change the letter by pressing the corresponding icon or the “Z” key. To return to the initial letter, simply press the “X” key, or its icon in the tool menu.
When displaying the stereo acuity chart with random dots, sometimes the patient does not understand what they are supposed to see. That is why we have drawn an “O” letter over a dot background (which is seen without stereopsis) to better explain to the patient what the test entails. To view this demonstration image, press the “P” key once (for “(P)review”), and again to return to the random dot stereo acuity chart.

In the tool menu, there is also an option for simple geometric shapes (square, circle, triangle, and star) to show to younger children. On the right menu, an icon is displayed to switch the stimulus from letters to geometric shapes (and vice versa). It is also possible to change the stimulus to geometric shapes by pressing the “G” key on the keyboard (pressing again will return to Symmetrical or Sloan letters).

Again, by pressing the “S” key (for stereopsis), the geometric shape seen by the patient is displayed in the lower-left corner, the stereo acuity value in the lower-right corner, and the size (VA) of the shape in the centre. To make this data disappear, simply press the “S” key or the menu icon again.

An icon is also included to directly change the letters from Symmetrical to Sloan and vice versa, although this can also be done by pressing the “L” key (for letter):

To standardize the random dot stereo acuity chart, the number of dots and their size are adjusted according to the viewing distance and the dimensions of each monitor. This way, the density of dots and the angle subtended by each dot (VA) remain constant regardless of the viewing distance and the size of the monitor, ensuring that all measurements are taken with the same parameters.
We have set the default dot density at 40% and the size of each dot at 0.3 log, based on the results obtained in clinical experiments. These values (Dot Size and Density) can be modified through the program’s configuration options.

However, in our preliminary studies, we have found that these two parameters do not seem very important, as the values of stereo acuity do not change significantly with variations in dot size or density. This same conclusion was reached in a recent study conducted on a sample of 113 patients with amblyopia, which can be found at the following link:
Influence of RDS Size and Density on Stereopsis in Curative Amblyopic Children
Remote Control via Tablet (Android or iPad) #
Below is the alternative menu for remote control of the Random Dot Stereo Acuity Chart, using an Android tablet or iPad:

The tablet screen includes all the icons from the tool menu and also displays the updated value of stereo acuity (300” in our example) and the letter or figure that is perceived in stereopsis (the symmetrical letter “O” in our example) at all times, without having to show them on the screen of the Vision Unit.
Automatic Stereo Acuity Calculation #
The program also allows us to automate the calculation of stereo acuity measurement, in the same way we do with visual acuity (VA) (see Automated VA Testing). Remember that we have two stereo acuity tests: the random dot chart and the bars chart.
Random Dot Chart #
Preliminaries #
When displaying the stereo acuity chart with random dots, sometimes the patient does not understand what they are supposed to see. That is why we have drawn an “O” over the dot background (visible without stereopsis), to better explain to the patient what the test involves. To see this demonstrative image, press the “P” key once (for “(P)review”), and again to return to the stereo acuity dot test.
Threshold Estimation #
Firstly, we will quickly determine the patient’s stereo acuity by pressing the up ↑ and down ↓ arrows on the keyboard, progressing in steps of double or half the stereo acuity. Once the initial value is established – where the patient makes an error – we can move to automatic calculation.
Automatic Calculation #
The automatic calculation works similarly to the Broken Glasses VA chart and begins in the same way when we press the numbers 1 or 0 on the keyboard (indicating whether the patient is correct or incorrect on this screen, respectively). The program will display 5 consecutive screens for each level of stereo acuity, randomly changing the letter shown. Each correct answer will add 1/5 of the minimum stereo acuity interval (which corresponds to the value of one pixel on the screen), and after showing the 5 screens, the stereo acuity value will be decreased by one step. In this test, we will use the default ending criterion of “3 or more errors”, but it can be changed to “4 or more errors” from the Configuration Options for more precise measurements.
For children under 6 years old, we will use “Matching Cards” to help conduct the Random Dot Stereo acuity Test.
Bars Chart #
As there are 4 response options on each screen, we will use the same criterion and measurement system as with the “Broken Glasses.”
When we press the number 1 or 0 (indicating whether the patient is correct or incorrect on this screen), we start the automatic calculation. There will be 5 random presentations for each level of stereo acuity, and each correct answer will add 1/5 of the minimum step of stereo acuity, as always. After showing the 5 screens, the stereo acuity value will be decreased by one step.
We will use the same ending criterion as with the “Broken Glasses” chart, that is, with 3 or more errors, the count stops.
Tablets and Remote Control #
If we wish to use a Tablet to display the Stereo Acuity charts, the tool menu incorporates two buttons with the numbers 0 and 1 so we can perform the automatic calculation.
A new blue button is also included to perform repeated measures of stereo acuity. We will press this blue button from the results screen to repeat the measurement.
Furthermore, if we use a Tablet as a remote control, the numbers, and the blue button will also be displayed in the tool menu.
Understanding Stereo Acuity Measurement #
Why do we measure Stereo Acuity? #
Measuring stereo acuity offers insights into the complex functionality of the visual system. Stereo acuity, or stereoscopic vision, is the culmination of the cerebral fusion of images from both eyes, requiring the visual system to operate at its best:
– High visual acuity in both eyes is crucial. Blurry images lack the detail for stereopsis, a challenge in cases of uncorrected refractive errors or amblyopia.
– The images from both eyes need to be similar in clarity and size for effective 3D perception, with stereopsis being compromised in conditions like Aniseikonia.
– Precise alignment of both eyes is essential for stereopsis. Strabismus eliminates stereoscopic vision, and marked fixation disparity in heterophorias diminishes stereo acuity.
This makes the stereo acuity test a powerful tool in paediatric screenings, indicating the absence of amblyopia, strabismus, significant anisometropia, or substantial astigmatism when good stereo acuity is present.
Measuring Stereo Acuity: Near Versus Far #
Traditionally, stereo acuity has been measured at near vision due to the lack of distant measurement charts. Incorporating distance measurements into practice can provide valuable insights for distance vision prescriptions, enhancing patient care.
Differences in Responses to Various Tests #
While most individuals with normal vision can achieve 60” or better in stereo acuity both at distance and near vision, responses to stereo tests can vary. These artificial tests have their limitations and can confuse some patients, affecting their performance despite normal binocular vision. Offering both contour-based and contour-less tests allows for accommodating individual differences.
It is worth remembering that perceiving stereo acuity often requires the patient to look for a few seconds before the three-dimensional vision effect emerges. Also, lighting is very important in these tests; it must be high.
Normal Values #
As mentioned, most people with normal vision reach stereo acuity values of 60” or better at a distance and near vision. Good stereo acuity in a test confirms effective visual acuity and binocular vision at that distance. Reduced stereo acuity warrants further investigation to identify underlying causes, ranging from amblyopia to misunderstanding the test. Comprehensive eye examinations are recommended for children failing to achieve expected stereo acuity levels.
Percentile Curves #
Recent research, including the first Stereo acuity Percentile Curves for Spanish children using the Optonet Vision Unit (formerly known as the Bueno-Matilla Unit), highlights the progressive improvement in stereo acuity with age, underscoring the test’s value in paediatric visual health.
At the age of 4, it was found that at the 50th percentile, children reached values close to 40 seconds of arc, while at 4 years and 9 months, values close to 28 seconds of arc were reached, which are the levels expected in the adult population. A progressive increase in stereo acuity was detected, reaching values of 19 seconds of arc before the age of 6 in the 50th percentile.
For further reading on this topic, visit:
https://www.sciencedirect.com/science/article/pii/S1888429621000650
Note: To display stereo acuity around 60” at near vision (about 45 cm) requires a high-resolution screen, ideally a 10-inch tablet with full HD resolution: 1920×1200 pixels.