Duochrome Charts #
Within the group of Refraction charts, there is a section for duochrome optotypes.
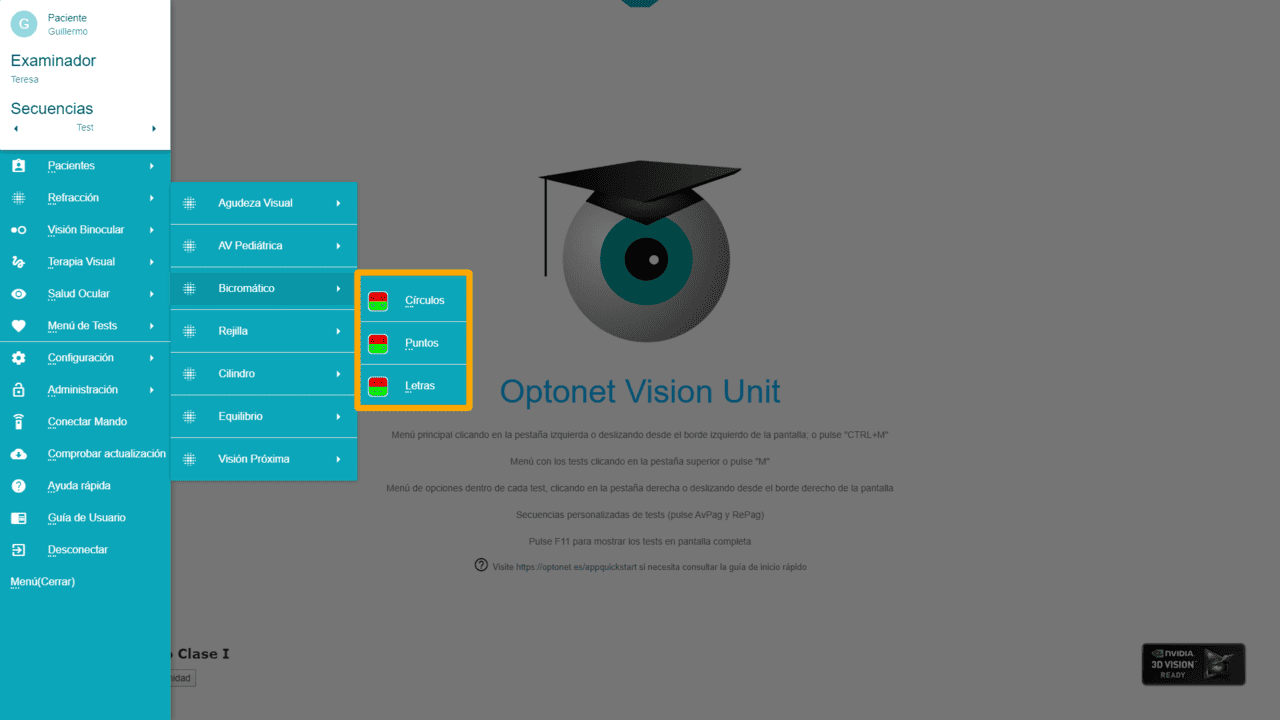
Duochrome (or bichromatic) charts are useful to determine the best sphere during subjective refraction. The basis for the red/green charts relies on the different focussing points in the eye for different wavelengths: If the images on the red background seem sharper and darker, then the eye needs more negative lenses, whereas a sharper image on the green background indicates the need for more positive lenses. For this test to be effective, it is required that the intensity of the red and green colours is similar. At the end of this section, we will explain how to calibrate their relative brightness in the Optonet Vision Unit.
This section comprises three kinds of bichromatic tests: concentric Circles, Dots, and Letters; all of which are displayed on red and green backgrounds, arranged in horizontal bands.
Concentric circles #
The first duochrome test shows a pair of concentric circles on each background. The program allows changing the size of the circles in steps of 50%, using the icons of the tools menu on the right (or by taping the “+” and “–” keys).
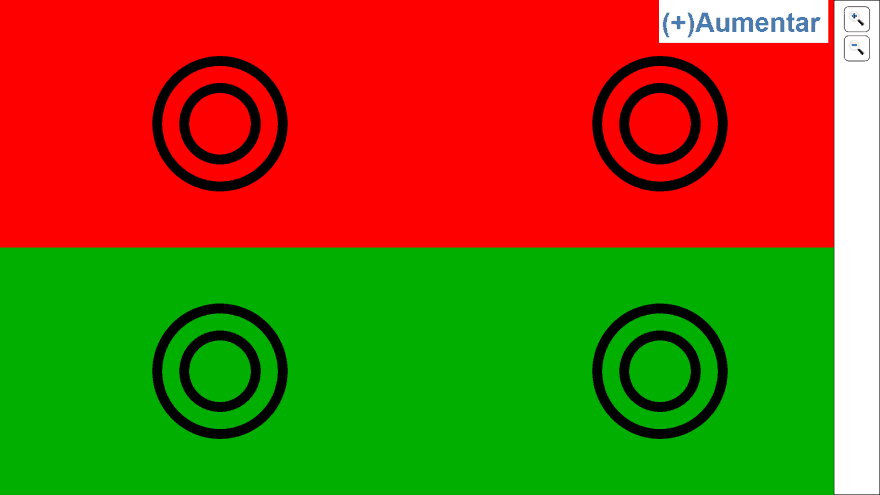
This test is usually displayed for fixation during retinoscopy, since it is easy to see when blurred and does not provide a stimulus for accommodation. In addition, the red and green offer a dim ambient light suitable for retinoscopy.
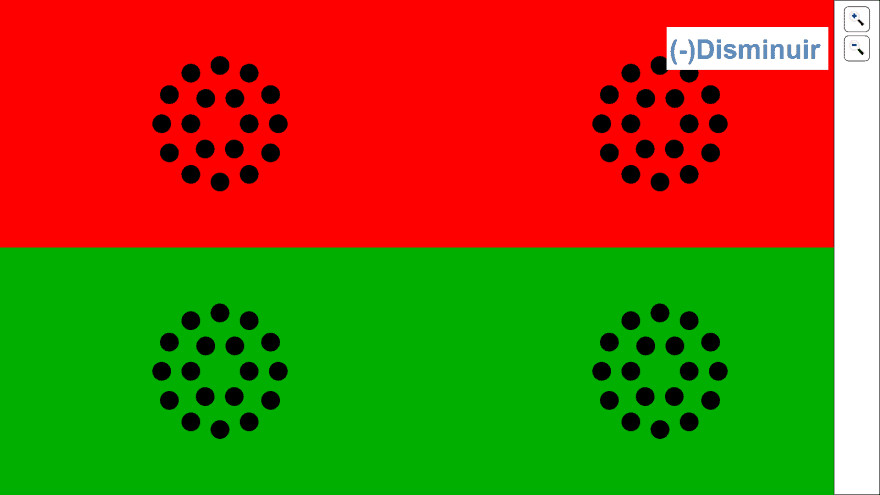
Dots #
The second bichromatic test consists of two circles of dots on each background. Again, their size can be modified with the right side menu or taping the same keys as before.
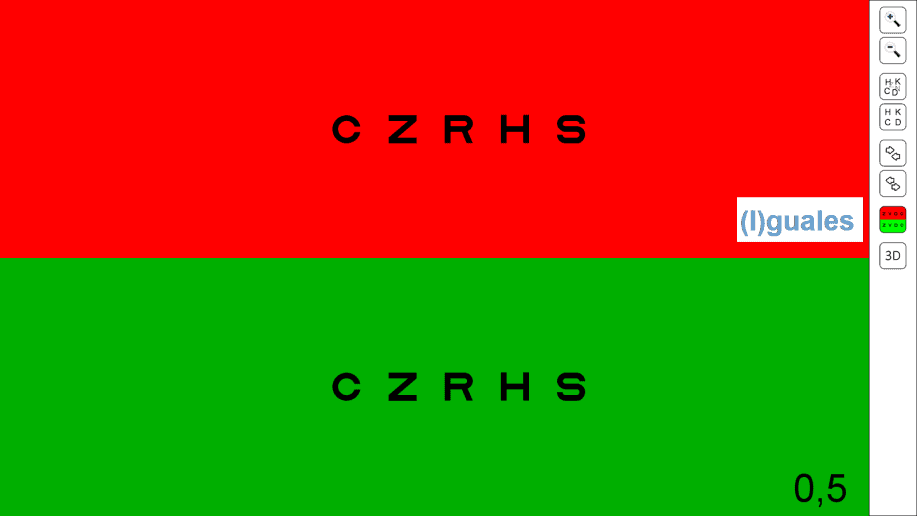
Letters #
The third bichromatic chart displays an isolated row of Sloan letters on each background. Initially, the test will open with a size of 85 VAR (equivalent to 6/12, 20/40 or 0.5 decimal). The size of these letters can be changed using the usual icons of the tools menu or the keyboard (but top and bottom lines always keep the same size to each other). VA sizes are shown in the lower right corner of the screen, as usual.
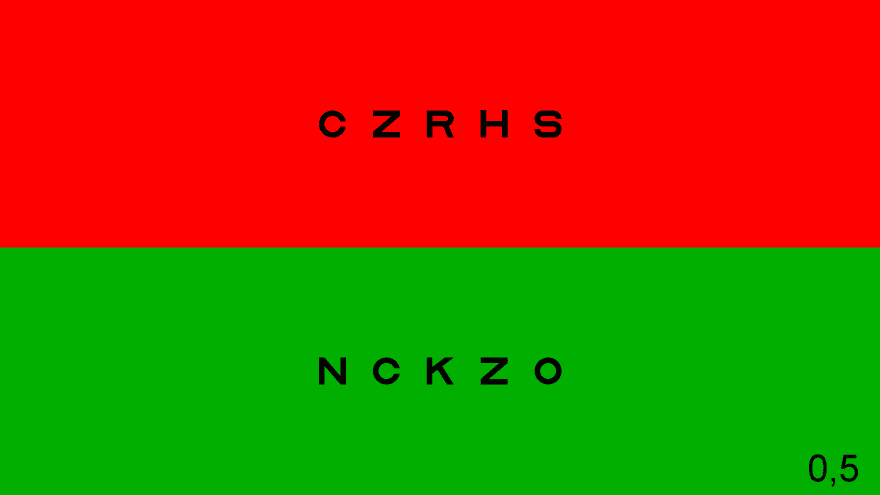
As with the rest of VA tests, we have an icon to randomly modify the combination of letters (also achieved by taping on the letter “Z”). There is another icon to go back to the initial set of letters (or by taping on the “X”).
The set of letters on the lower green background can be changed to be the same as the one shown above (on the red background), by taping the letter S ((S)ame) or with the button from the right tools menu. This facilitates the comparison of sharpness of the letters between both the red and green backgrounds.
Binocular duochrome #
The design of these bichromatic charts allows placing two polarizing filters over the screen, with perpendicular orientations, covering the right and left sides of the screen, respectively. If we have goggles with polarizing filters in the same orientations as those on the screen, we will have created a “Binocular Bichromatic Chart” on a conventional monitor, which is useful for binocular balance in patients with different visual acuities between their eyes.
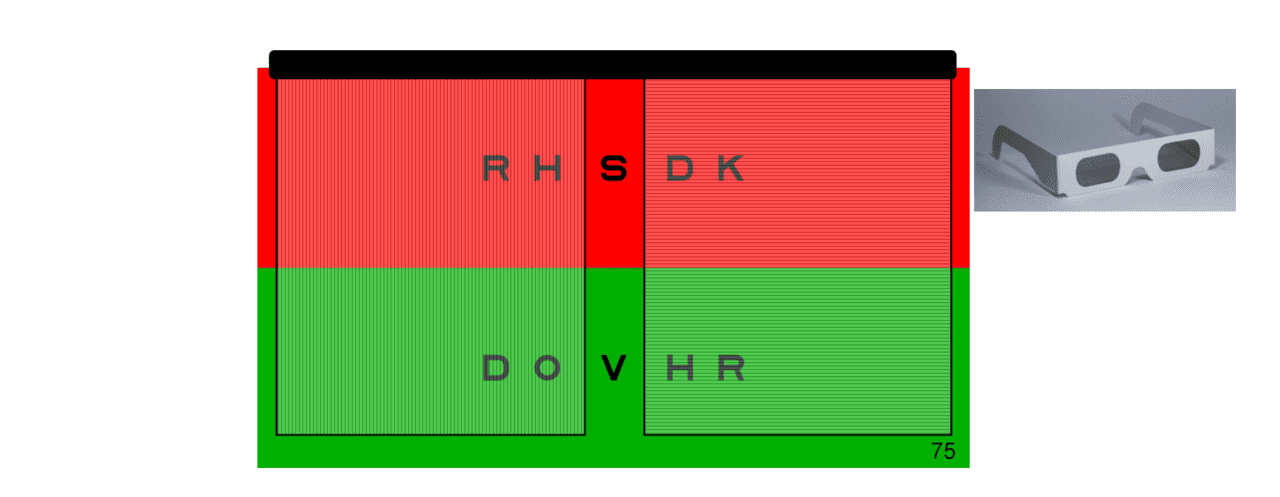
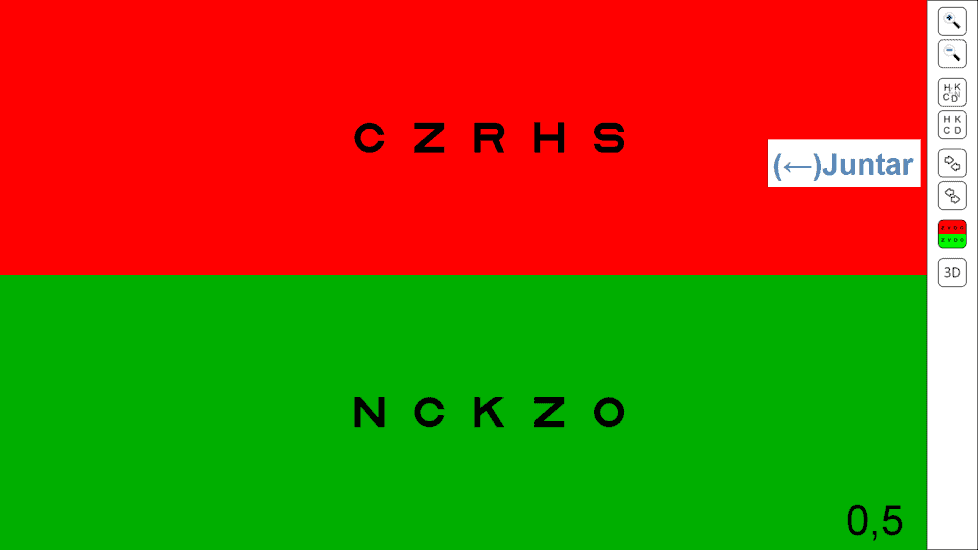
The tools menu on the right offers two options for separating the letters or to bring them closer together. This allows to best place them under the polarizing filters. The same actions can be achieved with the horizontal arrows on the keyboard (→ and ←). The separation chosen will be automatically saved, to be displayed every time this chart is shown (even after the program has been closed and launched again).
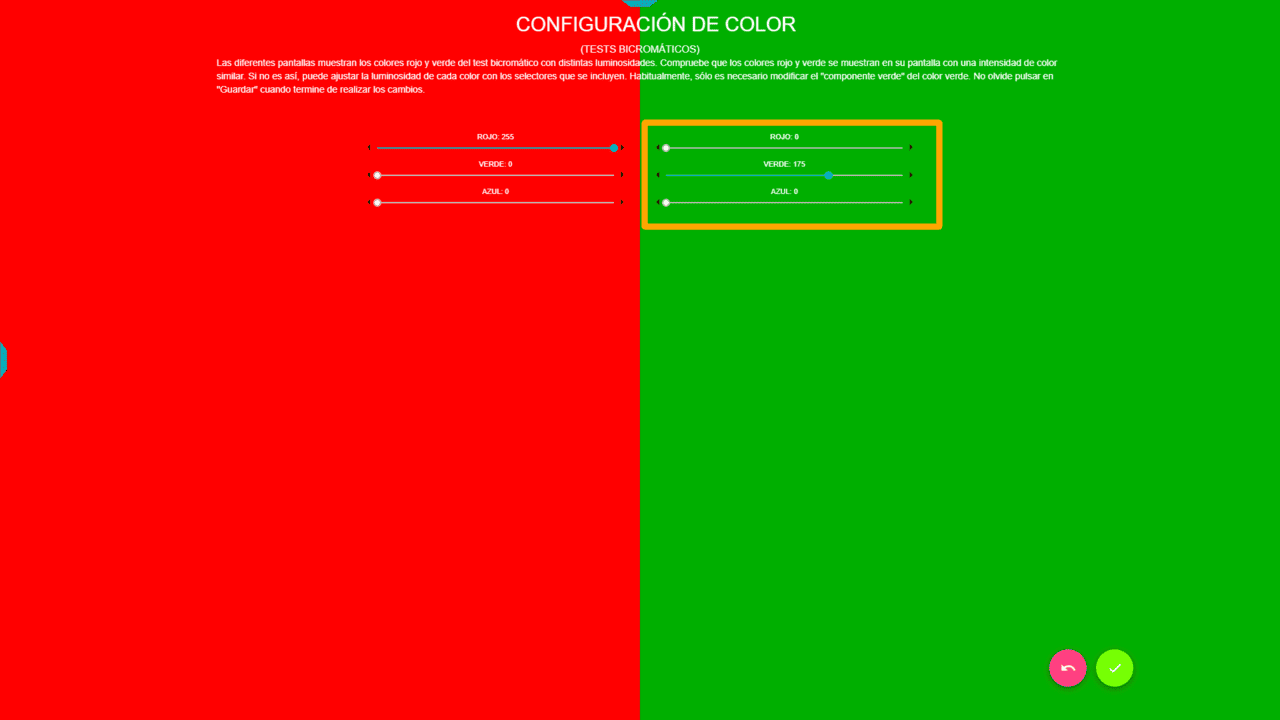
Calibrating Duochrome colours #
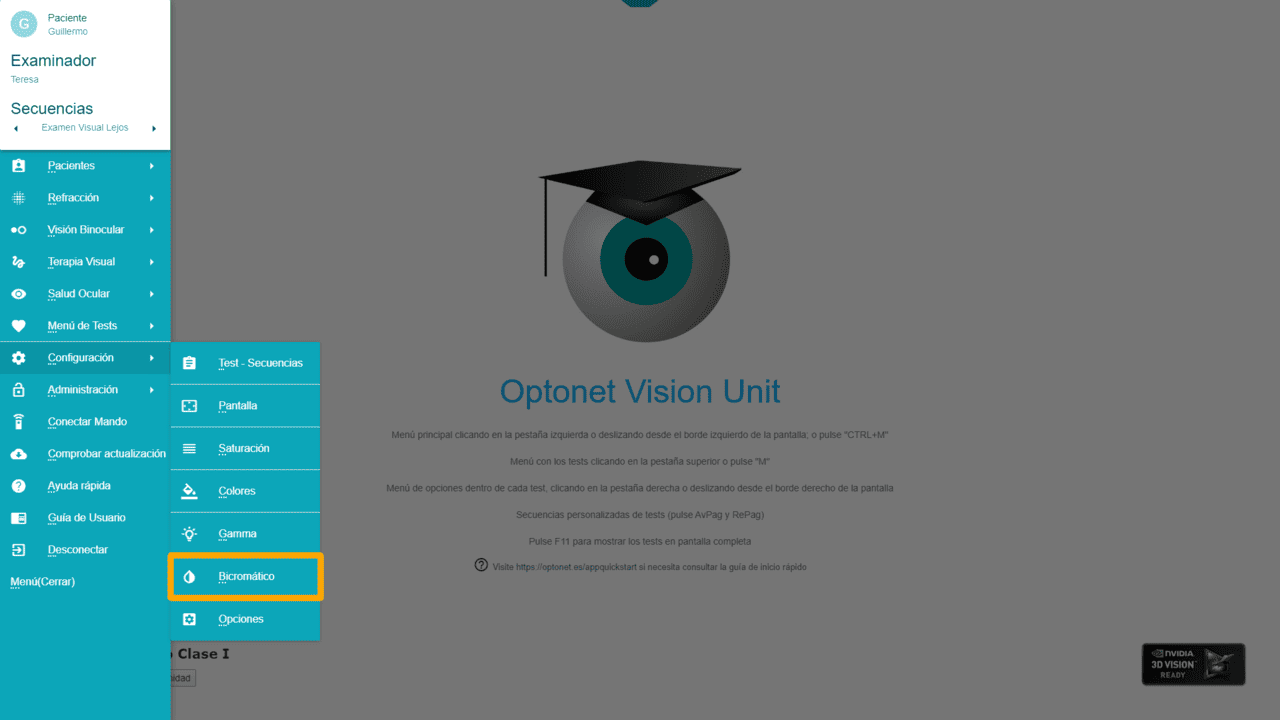
The intensity of the red/green colours shown may differ from one screen to another. It is therefore necessary to calibrate each screen once, to ensure a similar luminosity for these two colours. This can be performed from the duochrome calibration in the setup menu.
The green colour tends to be much brighter than red, so normally only the green component of the green colour (G) needs to be changed. The aim is to make sure that both shades have a similar luminosity. Clicking on the “Save” button will keep the changes.
Cross Cylinder Grid Test #
Distance vision #
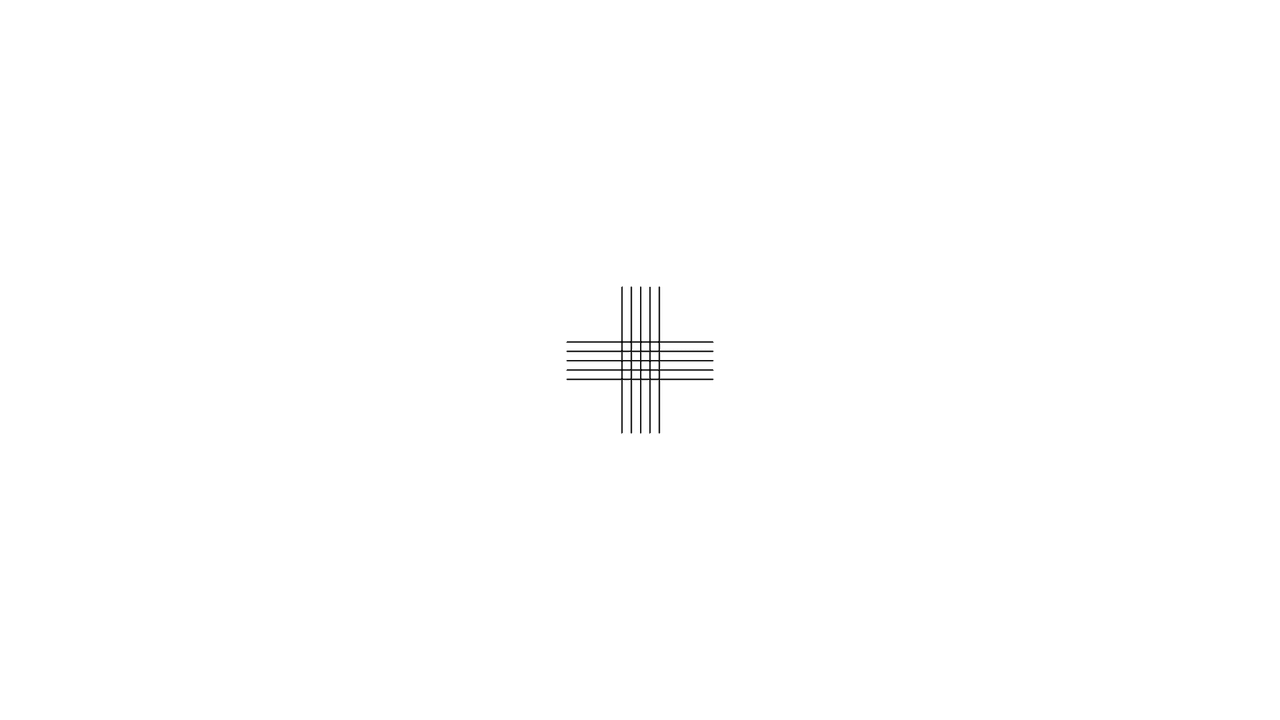
The next section within the Refraction group is the “Grid Test.” This test is designed to be viewed through a crossed cylinder lens, with its negative axis at 90 degrees.
The chart initially occupies the entire screen, but its size can be reduced with the usual zoom icons on the tools menu, in 12.5% steps (or tapping on the + / – keys). This is useful when using a very large screen, such as a television.
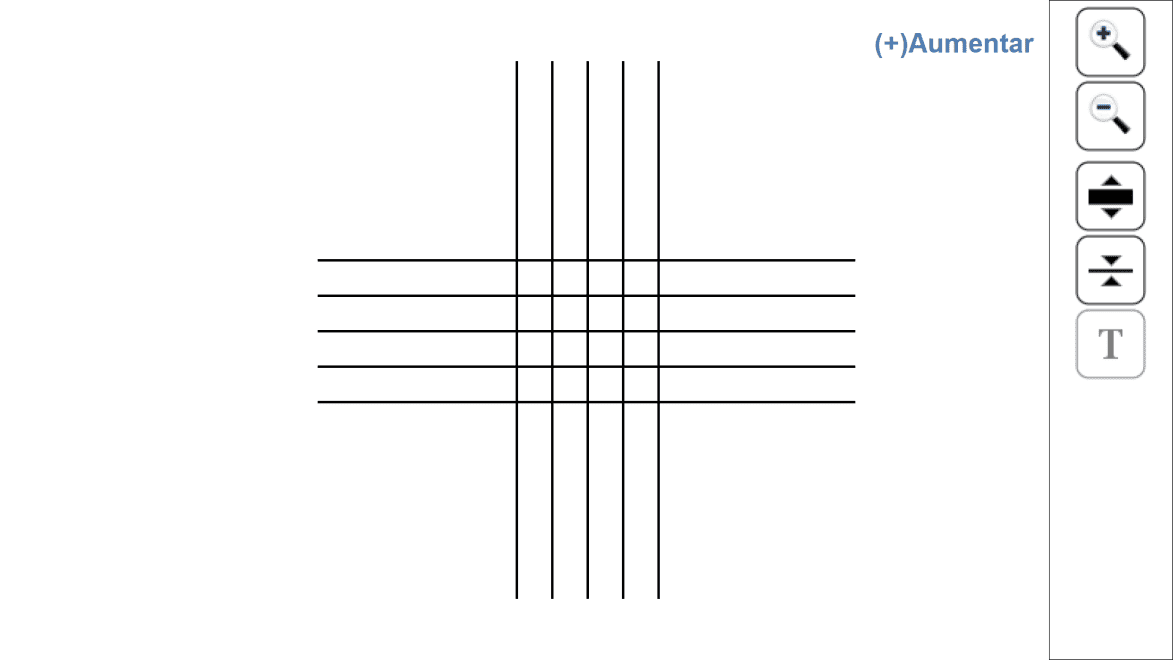
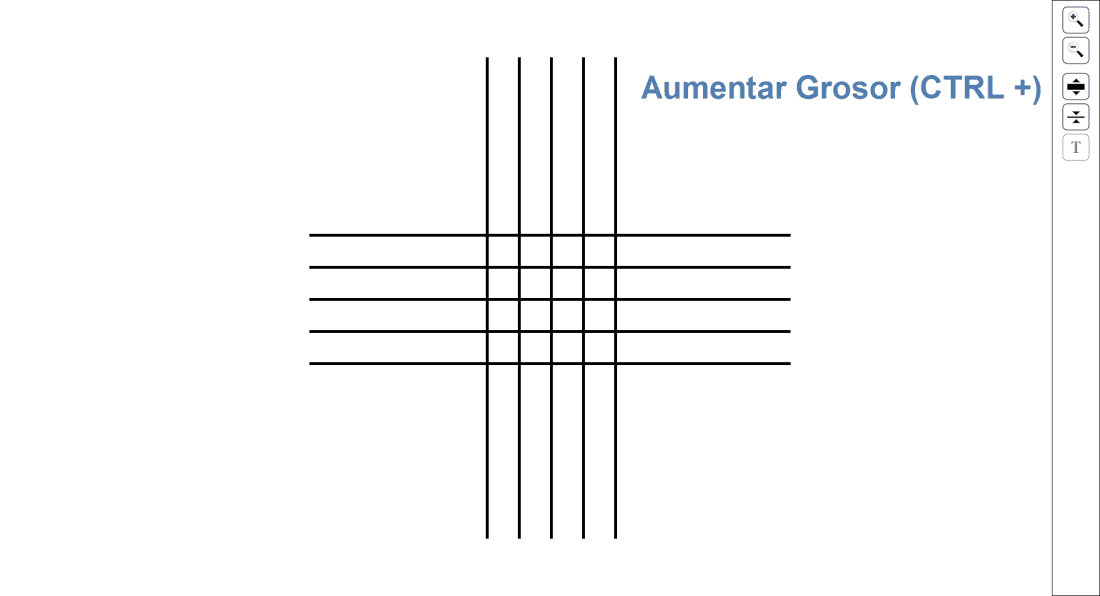
There is also the option to increase or reduce the thickness of the lines with the tools menu (or the combination of keys “Ctrl +” and “Ctrl -” respectively). Both the size and line thickness of the chart will be saved automatically, so that next time this chart is opened, it will display the last selected configuration.
Near vision #
When the viewing distance is set up to any value less than 1 metre, the application will default to its near vision mode, and two texts will appear on either side of the grid. This allows the patient to exert normal near vision before the test is performed.
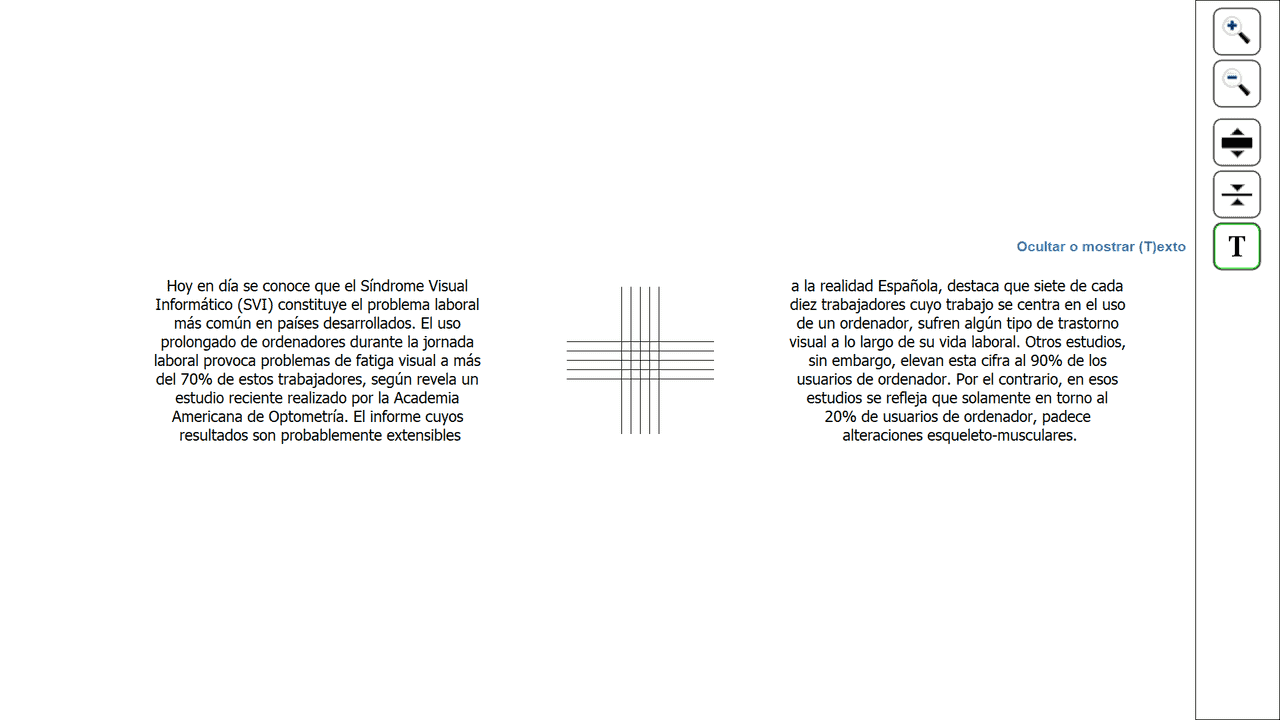
The texts can be hidden / showed again, by clicking on the corresponding icon of the tools menu (or tapping “T” on the keyboard). As before, the icons on the side menu allow varying the size of the grid in 12.5% steps; and/or changing the lines’ width.
Purpose of grid charts #
For distance vision, the grid test is used to determine the best sphere during subjective refraction, in a similar fashion than the more popular bichromatic tests. Since the responses may be affected by the presence of uncorrected astigmatism, this chart is most useful for fine-tuning the final sphere (monocular and/or binocularly), after the astigmatism has been corrected.
It is advisable to show the chart with a slight plus overcorrection, and confirm that the patient sees the vertical lines sharper (through the cross cylinder, its minus axis at 90º). Then plus power should be slightly reduced (or minus increased) in small steps until both sets of lines appear equally sharp. If the horizontal lines are darker, then the plus power needs to be increased.
For near vision, the grid is used binocularly (with a pair of cross cylinders) to assess accommodative response and/or to prescribe near plus additions (both in presbyopic and younger endophoric patients).
This test is useful to understand the interaction between accommodation and vergence for near vision in younger patients with symptoms, as it shows if the patient tends to accommodate in front of the plane of the chart (vertical lines seem darker), behind it (horizontal lines seem better) or on the plane of the chart (all lines equally sharp).