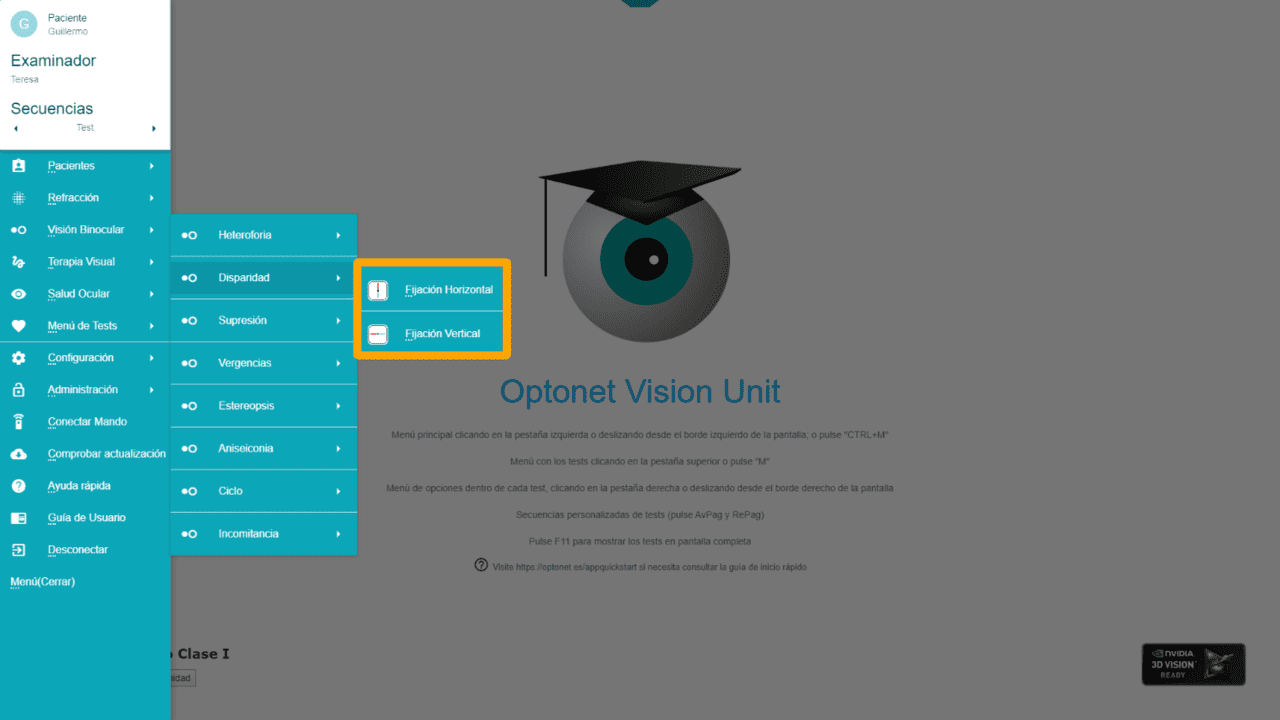
Horizontal Fixation Disparity (FD) #
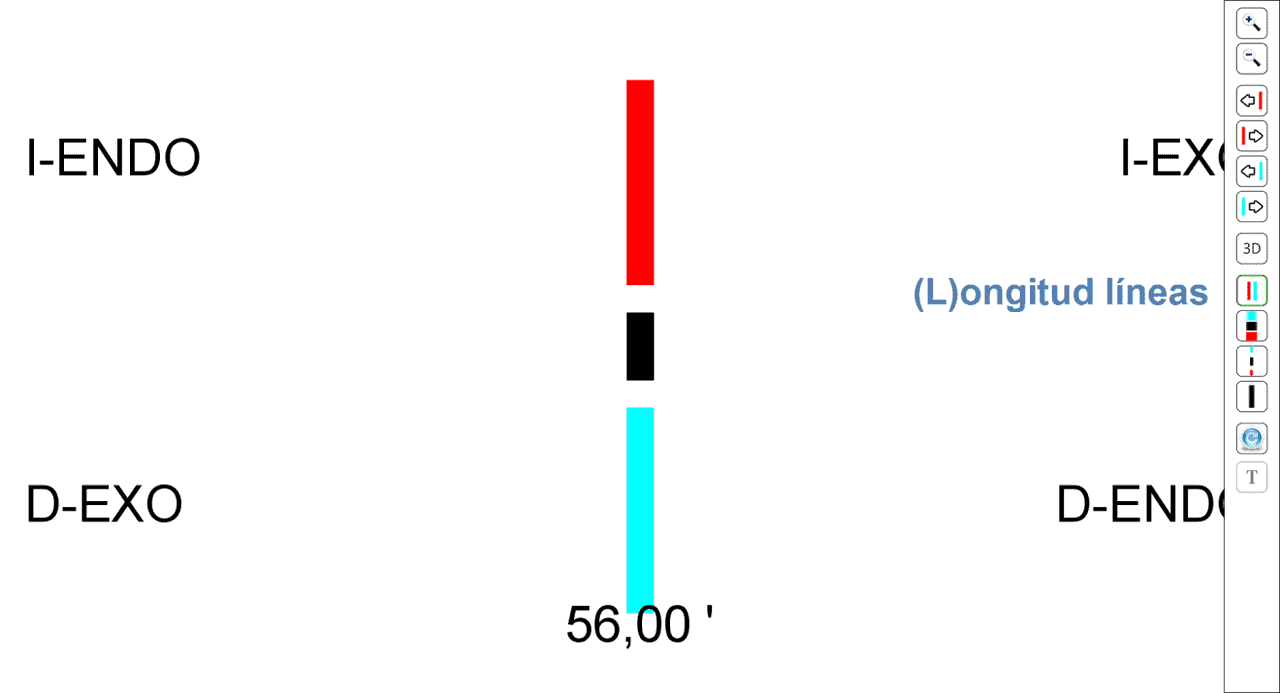
This chart requires the use of red/blue (or red/green) filters, always placing the red filter in front of the right eye. The horizontal fixation disparity test consists of a red and a blue bar aligned vertically (“Nonius Lines”), each observable by only one eye when using the filters. Between these two segments, there’s a small black rectangle visible to both eyes, serving as a central binocular stimulus (“Binocular Lock”).
If fixation disparity exists, one of the nonius lines will oscillate or slightly shift to one side. Depending on which line shifts, we can identify it as right eye’s disparity (when the blue line shifts) or the left eye’s (when the red line shifts).
The direction of the shift indicates whether the fixation disparity is “Exo” or “Eso,” as displayed on the test screen. For instance, if the patient observes the red line shifting to their right, it indicates a left eye Exo-Fixation Disparity (see image below).
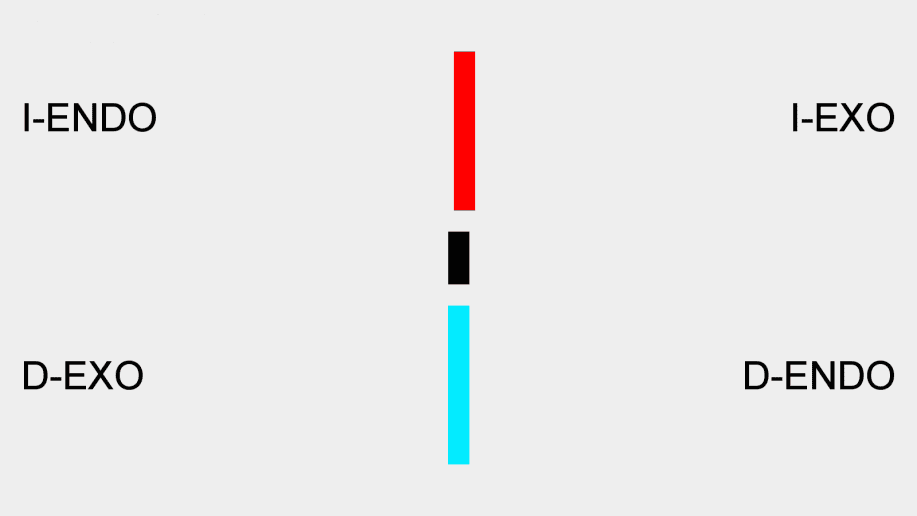
This image demonstrates what a patient with left eye Exo-FD would see through the filters.
When a patient has fixation disparity, we can measure it in arc minutes by adjusting the displaced lines until the patient sees all three bars perfectly aligned. We have arrows in the tool menu for this purpose:
![]()
![]()
![]()
![]()
In our previous example, since the patient observes the red line displaced to their right, we must move the red line in the opposite direction (i.e., to the left) to counter the deviation until the patient indicates that they see the red line well aligned with the black and blue lines.
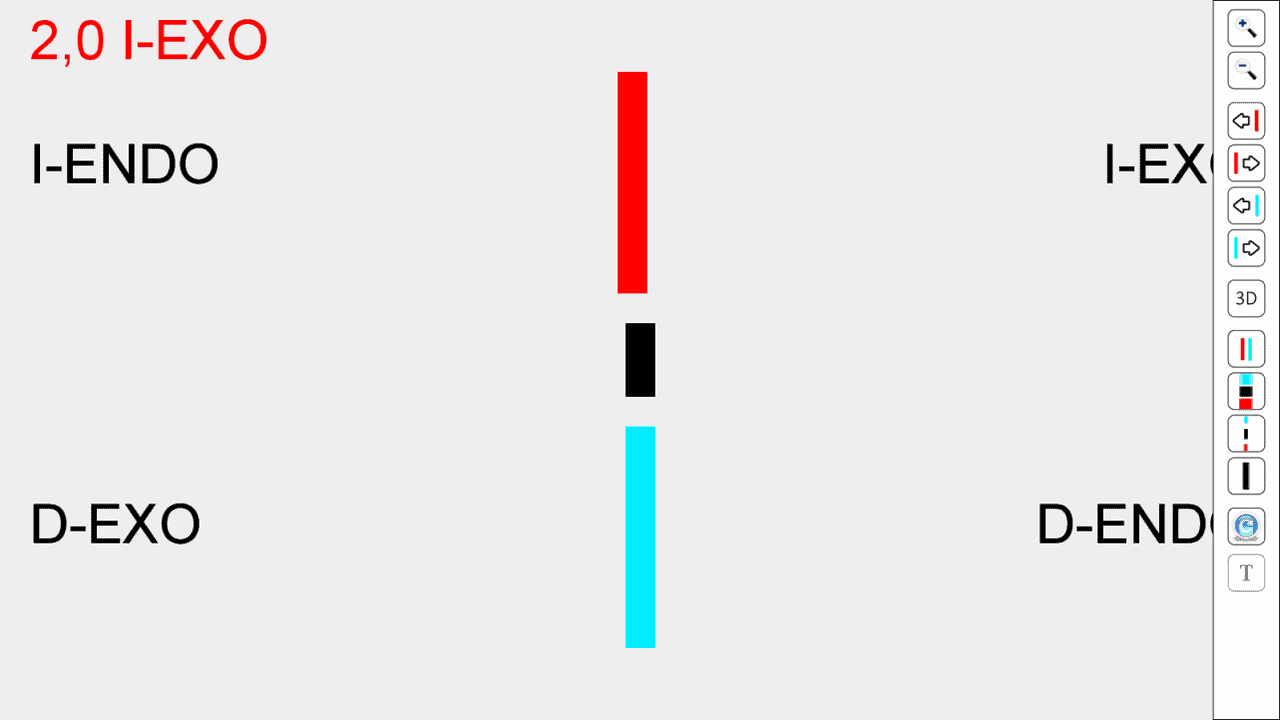
This image represents what needs to be displayed on the screen for the patient to observe the red line aligned with the other 2 lines when measuring the left eye Exo-FD in the previous example
The measurement value of fixation disparity is given by the amount of displacement applied to the coloured line and is displayed on the screen, expressed in arc minutes: in red for the left eye and blue for the right eye. It also indicates the type of deviation (Eso or Exo) and the eye involved. In our example, it’s a left eye Exo-FD of 2.0 arc minutes.
The red line can also be moved by pressing the right (→) and left (←) arrows on the keyboard, while to move the blue segment, press the down (↓) and up (↑) arrows on the keyboard, which will move it to the right and left, respectively.
The FD test is calibrated in arc minutes for the observation distance defined in the settings. The step values in arc minutes displayed will depend on the monitor’s resolution. For example, typical values are 0.2 arc minutes steps for a 23″ full HD screen placed 5 meters away.
Associated Phoria #
This test also allows measuring horizontal Associated Phoria by neutralizing the FD with prisms in the eye presenting the deviation. Base-out prisms are used to neutralize eso-FD and base-in for exo-FD.
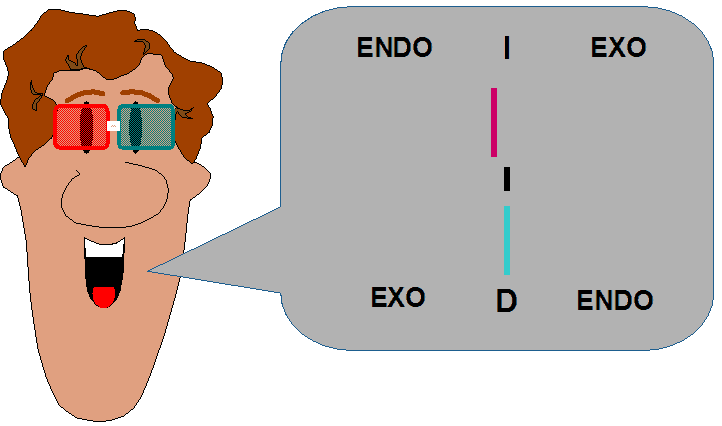
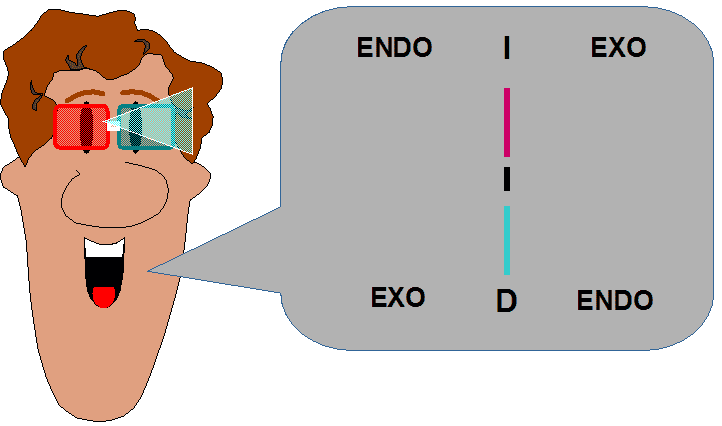
Measuring Associated Phoria with a base-out prism in a patient with left eye Eso-FD.
As usual, the chart includes a pair of zoom buttons to modify the test size by a factor of x1.25. The “+” and “−” keys can also be used. The chosen size in the last program execution will be saved for the next session.

Vertical Fixation Disparity (FD) #
The Vertical Fixation Disparity (FD) test operates similarly to the horizontal test, with the difference that the “nonius” lines are now arranged horizontally.
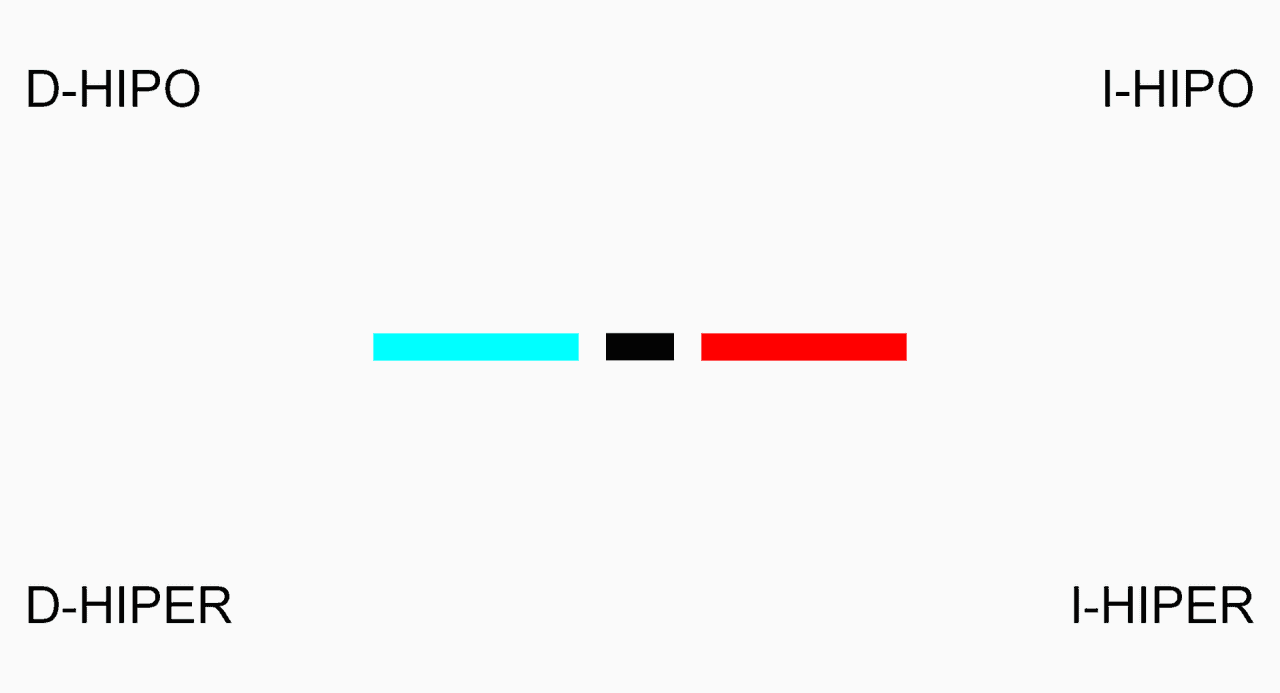
This test is also designed for the patient to view through red/blue glasses, with the red filter in front of the right eye (OD), at the selected distance.
Like in the horizontal FD chart, this test indicates whether the deviation is Hyper-FD or Hypo-FD and to which eye it corresponds.
To measure vertical FD in arc minutes, it suffices to move the line that the patient sees displaced by clicking on the corresponding icons…
![]()
![]()
![]()
![]()
…until the patient sees all lines aligned. The up (↑) and down (↓) arrows can be used to move the red line, while the right (→) and left (←) arrows on the keyboard will move the blue line down and up, respectively.
Moving one of the colour bars will display the vertical FD value in arc minutes on the screen, corresponding to that displacement.
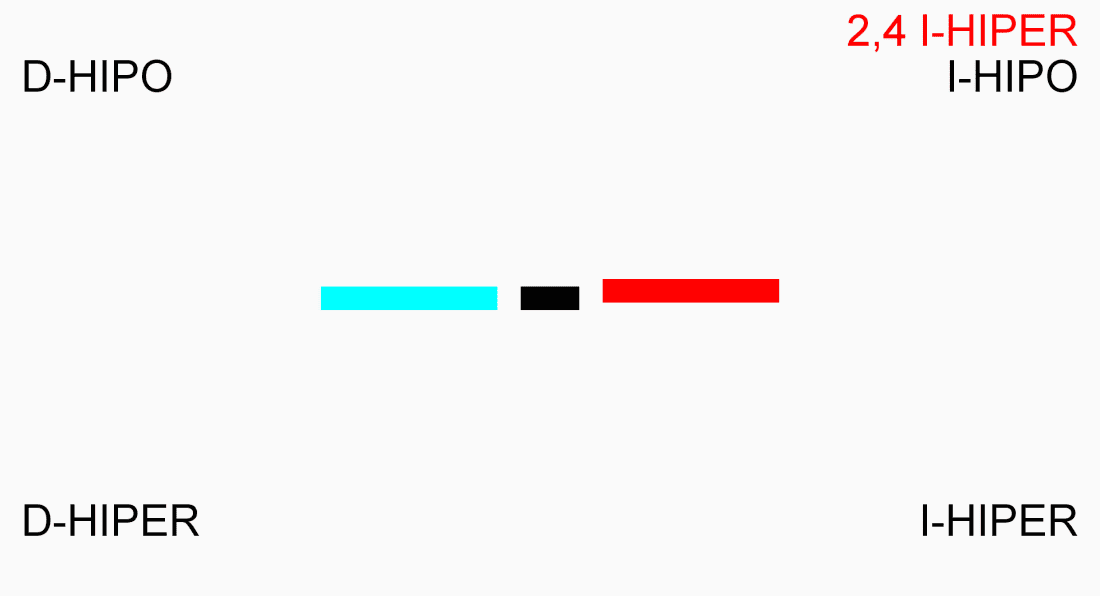
The test also allows measuring the vertical Associated Phoria, determined by the same procedure as the horizontal: placing prisms in front of the affected eye until the patient perceives the lines perfectly aligned. For Hyperphoria, we place a prism with the base down and for Hypophoria with the base up.
Near Vision #
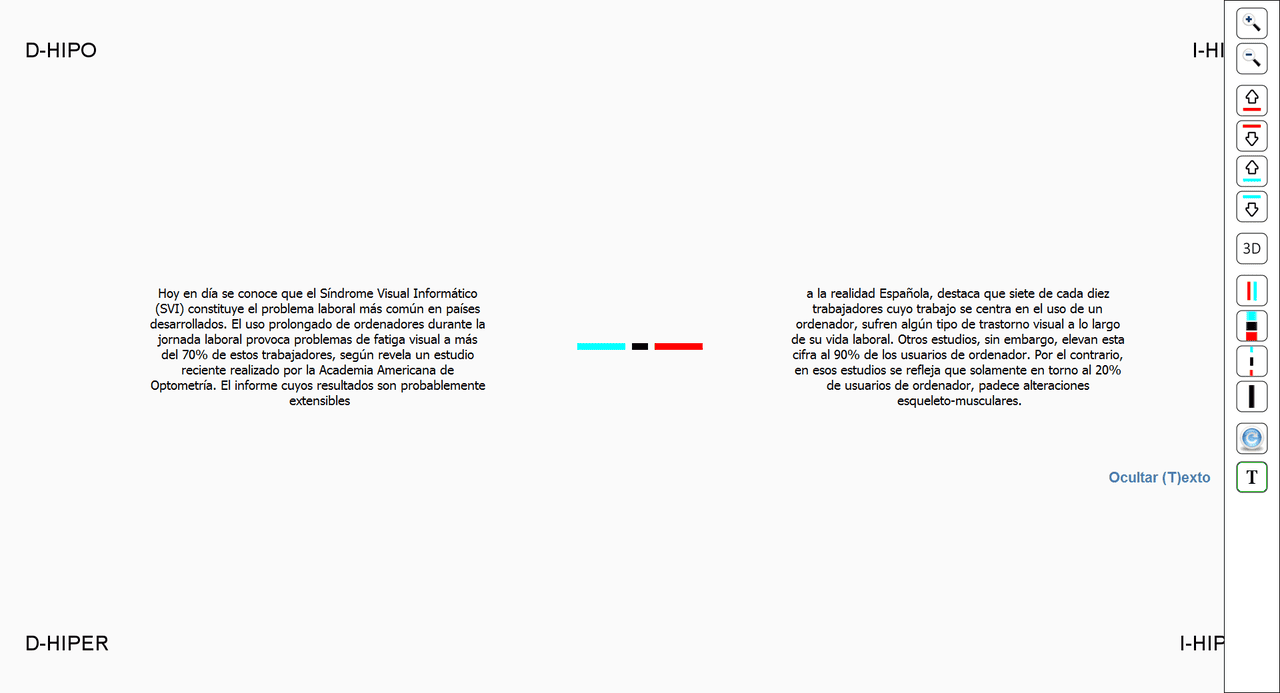
If the Unit is calibrated for near vision, the Fixation Disparity charts will be surrounded on both sides by two paragraphs of text, allowing the patient to use their binocular vision normally before taking the test. These texts can be hidden by clicking on the corresponding icon in the tool menu (or pressing the “T” key on the keyboard).
Use of Fixation Disparity Tests #
These tests allow calculating Fixation Disparity and Associated Phoria (Horizontal and Vertical) with the aim of investigating the compensation of horizontal and vertical Heterophorias.
DF tests are particularly useful for calculating the amount, direction, and eye where a prismatic correction is to be prescribed, as treatment to relieve asthenopic symptoms in decompensated heterophorias.
They can also be used to determine the amount of addition in patients with esophorias and symptoms.
Parameter Configuration #
The tool menu also includes a series of icons to modify the following test parameters (this function is intended for research studies):
– Length of the red and blue bars.
– Thickness of the 3 bars.
– Separation between each of the colour bars concerning the central black bar.
– Length of the central black reference bar.
Clicking on each of these icons displays the measurement of the selected parameter in arc minutes at the bottom of the screen. Once a parameter is selected, its measurement can be modified with the zoom icons (or the “+” and “-” keys), in steps of 2 arc minutes.
